Renewable & Alternative Fuels
Current Issues & Trends See more ›


Recent Data
| 2013 | 2014 | 2015 E | 2016 P | |||
|---|---|---|---|---|---|---|
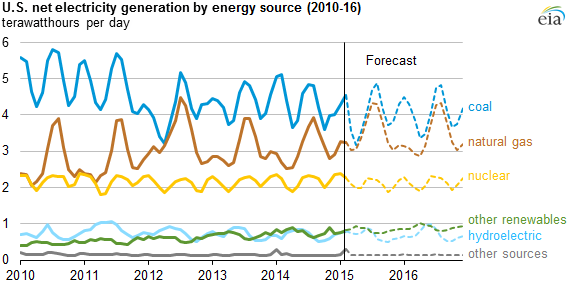
| Hydroelectric power | 2.562 | 2.469 | 2.257 | 2.415 | ||
| Geothermal | 0.214 | 0.222 | 0.226 | 0.236 | ||
| Solar | 0.305 | 0.427 | 0.522 | 0.624 | ||
| Wind | 1.596 | 1.729 | 1.765 | 2.042 | ||
| Wood biomass | 2.170 | 2.214 | 2.041 | 1.980 | ||
| Ethanol | 1.090 | 1.107 | 1.141 | 1.144 | ||
| Biodiesel | 0.205 | 0.198 | 0.222 | 0.261 | ||
| Waste biomass | 0.496 | 0.488 | 0.494 | 0.502 | ||
| Total | 9.349 | 9.603 | 9.432 | 9.970 | ||
| Source: Short-Term Energy Outlook Renewables and Carbon Dioxide Emissions | ||||||
Updated Data Series
- Renewable energy production and consumption by source
- Net generation for conventional hydroelectric
- Net generation for other renewables
Survey Forms, Changes & Announcements
Recent Analysis & Projections

Short-Term Energy Outlook - renewables section
Released January 10, 2017 STEOalternative fuelsforecasts/projectionsmonthlymost popularrecurringvehicles
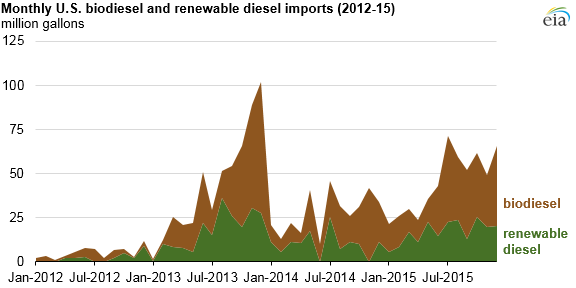
Monthly Biodiesel Production Report
Released December 30, 2016 alternative fuelsbiofuelsconsumption/demandcrude oildieselinventories/stocksmonthlymost popularoil/petroleumpricesproduction/supplyrecurringreservessales-
Monthly/Annual Energy Review - renewable section
Released December 22, 2016 alternative fuelsmost popularrecurring -
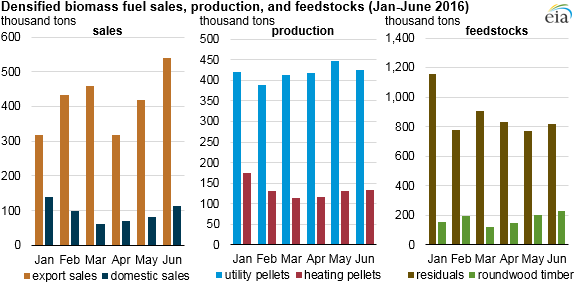
Monthly Densified Biomass Fuel Report
Released December 12, 2016 alternative fuelsbiofuelsbiomassconsumption/demandexports/importsmost popularpricesproduction/supply -
Alternative Fuel Vehicle Data
Released May 12, 2016 alternative fuelsannualenvironmentexports/importsmost popularnatural gasrecurringtransportationvehicles
See more analysis & projections ›
Upcoming Releases
U.S. Fuel Ethanol Plant Production Capacity: June 2016
Interactive Visualizations, Data, & Multimedia
- Alternative Fuel Vehicle Data Browser
- U.S. Renewable Infrastructure Map
- U.S. Renewable Resource Map
- U.S. Energy Disruptions Map
-
STEO
Data Browser -
AEO
Table Browser