Maps and Data
Find maps and charts showing transportation data and trends related to alternative fuels and vehicles.
OR
Sort by:
15 results
-
-
Average Annual Fuel Use of Major Vehicle Categories
Comparison of fuel use (per vehicle) among vehicle types Last update June 2015
-
-
-
Average Annual Vehicle Miles Traveled of Major Vehicle Categories
Comparison of miles traveled (per vehicle) among vehicle types Last update June 2015
-
-
-
Average Fuel Economy at Different Road Grades
Trend of Fuel Economy and Consumption at different road grades, for various vehicle types Last update August 2014
-
-
-
Average Fuel Economy of Major Vehicle Categories
Comparison of fuel economy among vehicle types Last update June 2015
-
-
-
Average Per-Passenger Fuel Economy of Various Travel Modes
Comparison of per-passenger fuel economy for various modes of transportation. Last update December 2016
-
-
-
Clean Cities Petroleum Savings by Fuel Economy and VMT Reductions
Trend of displacement by fuel economy improvement and VMT reduction projects from 2004-2013 Last update December 2014
-
-
-
Clean Cities Petroleum Savings by Idle Reduction
Trend of displacement by idle reduction policies and technologies from 2004-2013 Last update December 2014
-
-
-
Composition of New U.S. Light-Duty Vehicles by Vehicle Type Over Time
Shifting popularity of cars and trucks by year Last update July 2014
-
-
-
Efficiency and Power of U.S. Light-Duty Vehicles Over Time
Trend of horsepower and fuel efficiency 1975-2014 Last update August 2015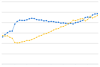
-
-
-
Energy Use in Light-Duty Vehicles
Percentage of energy used and lost in light-duty vehicles Last update September 2013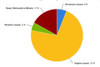
-
-
-
Fuel Economy at Various Driving Speeds
Trend of fuel efficiency at different speeds, grouped by vehicle age Last update April 2013
-
-
-
Per Capita Energy Expenditures by Sector
Trend of transportation and residential energy expenditures from 1970-2010 Last update September 2013
-
-
-
Relationship Between Light-Duty Fuel Economy and Lifetime Fuel Use
Relationship between fuel economy and lifetime fuel consumption for LDVs from 8mpg to 120mpg Last update June 2012
-
-
-
Transportation Fuel Use by Mode
Percentage of fuel used by various transportation modes in the U.S. Last update April 2016
-
-
-
Vehicle Fuel Efficiency (CAFE) Requirements by Year
Trend of CAFE vehicle fuel efficiency standards from 1978-2025 Last update September 2013
-

Average Annual Fuel Use of Major Vehicle Categories
| Class 8 Truck | Transit Bus | Refuse Truck | Para. Shuttle | Taxi | Delivery Truck | School Bus | Police | Light Truck | Light-Duty Vehicle | Car | Motorcycle | |
| Annual Fuel Use (GGE) | 12888.821090640513 | 10439.606743973143 | 9876.738305941846 | 3065.0279752884953 | 2813.296 | 1974.1539589904962 | 1896.3337547408344 | 1423.4741784037558 | 682.5238479581914 | 524.4252310096491 | 480.28320547749854 | 55.64944206208696 |
Source: Federal Highway Administration Table VM-1 and American Public Transit Association's Public Transportation Fact Book Tables 6, 7, and 20.
Notes: Fuel use is measured in gasoline-gallon equivalents (GGEs), representing a quantity of fuel with the same energy content as a gallon of gasoline.
This chart shows average annual fuel use (per vehicle) of major vehicle categories in the United States. The two factors affecting the average annual fuel use of a vehicle are the average miles per year (correlative) and the fuel economy of the vehicle (inversely correlative). Class 8 trucks, which typically travel long distances carrying heavy loads, consume more fuel on average than any other vehicle type. Transit buses and refuse trucks also use large quantities of fuel since they both log high numbers of miles on average and have relatively low fuel economy. The last four vehicle types are owned by individual consumers, and they each use a fraction of the fuel used by fleet-based vehicles, on a per-vehicle basis. See also Average Annual Vehicle Miles Traveled by Major Vehicle Categories and Average Fuel Economy of Major Vehicle Categories.
Print