Maps and Data - Clean Cities Petroleum Savings by Fuel Economy and VMT Reductions
Find maps and charts showing transportation data and trends related to alternative fuels and vehicles.
OR
Sort by:
130 results
-
Vehicles: Fuel Consumption and Efficiency
-
-
Clean Cities Petroleum Savings by Idle Reduction
Trend of displacement by idle reduction policies and technologies from 2004-2013 Last update December 2014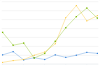
-
-
-
Composition of New U.S. Light-Duty Vehicles by Vehicle Type Over Time
Shifting popularity of cars and trucks by year Last update July 2014
-
-
-
Efficiency and Power of U.S. Light-Duty Vehicles Over Time
Trend of horsepower and fuel efficiency 1975-2014 Last update August 2015
-
-
-
Energy Use in Light-Duty Vehicles
Percentage of energy used and lost in light-duty vehicles Last update September 2013
-
-
-
Fuel Economy at Various Driving Speeds
Trend of fuel efficiency at different speeds, grouped by vehicle age Last update April 2013
-
-
-
Per Capita Energy Expenditures by Sector
Trend of transportation and residential energy expenditures from 1970-2010 Last update September 2013
-
-
-
Relationship Between Light-Duty Fuel Economy and Lifetime Fuel Use
Relationship between fuel economy and lifetime fuel consumption for LDVs from 8mpg to 120mpg Last update June 2012
-
-
-
Transportation Fuel Use by Mode
Percentage of fuel used by various transportation modes in the U.S. Last update April 2016
-
-
-
Vehicle Fuel Efficiency (CAFE) Requirements by Year
Trend of CAFE vehicle fuel efficiency standards from 1978-2025 Last update September 2013
-
-
Vehicles: Vehicle Market
-
-
AFV and HEV Model Offerings, By Manufacturer
Trend of AFV models produced by OEMs from 1991-2016 Last update March 2016
-
-
-
BioFuels Atlas
BioFuels Atlas is an interactive map for comparing biomass feedstocks and biofuels by location. This tool helps users select from and apply biomass data layers to a map, as well as query and download biofuels and feedstock data. The state zoom function summarizes state energy use and infrastructure for traditional and bioenergy power, fuels, and resources. The tool also calculates the biofuels potential for a given area. BioFuels Atlas was developed by the National Renewable Energy Laboratory with funding from the DOE Biomass Program.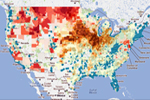
-
-
-
Light-Duty Vehicles Sold in the U.S.
Trend in the number and types of light-duty vehicles being sold in the U.S. from 1975-2013 Last update June 2014
-
-
-
Self-Propelled Vehicles by Mode in the U.S.
Last update September 2013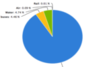
-
-
-
TransAtlas
TransAtlas is an interactive map that uses a Google Maps interface to display: Existing and planned alternative fueling stations Alternative fuel production facilities Light-duty vehicle density Roads and political boundaries Users can customize the map display and print and query the underlying data. TransAtlas is part of a suite of geographic analysis tools for renewable energy developed at the National Renewable Energy Laboratory.
-
-
-
Types of Vehicles by Weight Class
Last update June 2012
-
-
-
Vehicle Weight Classes & Categories
Last update June 2012
-
-
Vehicles: Driving Patterns
-
-
Annual Vehicle Miles Traveled in the U.S.
Trend of Vehicle-Miles Traveled in the U.S. from 1970-2016 Last update August 2016
-
-
-
Average Commute to Work by State (Shortest and Longest)
Commute length for states with the most extreme commute times Last update August 2015
-
-
-
Average Fuel Economy of Major Vehicle Categories
Comparison of fuel economy among vehicle types Last update June 2015
-
-
-
Average Vehicle Trip Length by Purpose
Average trip length and distribution by trip type in U.S., 2009 Last update May 2012
-
-
-
Means of Transportation to Work
Trend of how people commuted to work from 1980-2012 Last update August 2014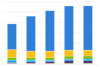
-
-
-
Monthly Fluctuation in U.S. Vehicle Miles Traveled
VMT for each month of the year, averaged over a five year period Last update August 2015
-
-
-
Share of All Vehicle Trips by Trip Length
Average trip length and distribution by trip type in U.S., 2009 Last update September 2011
-
-
-
U.S. Light-Duty Fuel Consumption and Vehicle Miles Traveled (VMT)
Trend of per capita VMT and fuel use in U.S. light-duty vehicles from 1970-2012 Last update July 2014
-
-
Fuels & Infrastructure: Fuel Trends
-
-
Annual Percent Growth of Vehicles in Operation
Last update October 2016
-

Clean Cities Petroleum Savings by Fuel Economy and VMT Reductions
| 2004 | 2005 | 2006 | 2007 | 2008 | 2009 | 2010 | 2011 | 2012 | 2013 | |
| Fuel Economy Improvement | 0.01 | 0.04 | 5.5 | 2.4 | 0.4 | 2.6 | 4.4 | 10.4 | 13.6 | 15.370752425167996 |
| VMT Reduction | 0.15 | 1.5 | 1.9 | 2.7 | 3.5 | 5.7 | 23.2 | 34.5 | 40.5 | 37.071304167168016 |
Source: Clean Cities annual metrics reports, 2004-2013.
Notes:
Savings are measured in gasoline-gallon equivalents (GGEs), representing a quantity of fuel with the same amount of energy contained in a gallon of gasoline.
This chart shows Clean Cities petroleum savings achieved through fuel economy improvements and reductions in vehicle miles traveled (VMT) from 2004 through 2013.
VMT reduction includes measures such as carpooling, telecommuting, using mass transit, bicycling, and improved route planning.
Print