|
Download Data (XLS File) |
|
|||||
|
|||||
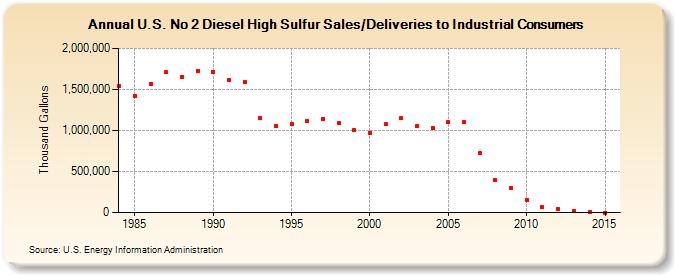
| U.S. No 2 Diesel High Sulfur Sales/Deliveries to Industrial Consumers (Thousand Gallons) | |||||
| Decade | Year-0 | Year-1 | Year-2 | Year-3 | Year-4 | Year-5 | Year-6 | Year-7 | Year-8 | Year-9 |
|---|---|---|---|---|---|---|---|---|---|---|
| 1980's | 1,542,529 | 1,420,487 | 1,571,838 | 1,707,821 | 1,653,853 | 1,730,405 | ||||
| 1990's | 1,715,660 | 1,611,596 | 1,585,527 | 1,150,008 | 1,051,557 | 1,077,795 | 1,114,789 | 1,145,216 | 1,093,405 | 1,005,296 |
| 2000's | 973,404 | 1,073,094 | 1,150,692 | 1,053,960 | 1,033,041 | 1,101,684 | 1,104,644 | 727,167 | 390,699 | 296,278 |
| 2010's | 153,432 | 63,492 | 42,410 | 18,975 | 2,565 | 301 |
| - = No Data Reported; -- = Not Applicable; NA = Not Available; W = Withheld to avoid disclosure of individual company data. |
| Release Date: 12/5/2016 |
| Next Release Date: Last Week of November 2017 |