
Use this diagram to explore (zoom, pan, select) and compare energy flows across U.S. manufacturing and key subsectors. Line widths indicate the volume of energy flow in trillions
of British thermal units (TBtu). The 15 manufacturing subsectors together consume 95% of all energy used by U.S. manufacturing, not including the energy value of fuels used as raw
materials (feedstocks). The underlying data source for Manufacturing Energy Flows is the Manufacturing Energy and Carbon Footprints.
About the Data
Help
Legend (TBtu):
Fuel
Steam
Electricity
Combined Energy
Applied Energy
Energy Lost
+
-
Save Image
Reset
Customize Display
Click on a sector name below to update the Energy Flow diagram, and use the selection buttons to zoom for more detail.
All Manufacturing
Alumina and Aluminum
Cement
Chemicals
Electronics
Fabricated Metals
Food & Beverage
Forest Products
Foundries
Glass
Iron & Steel
Machinery
Petroleum Refining
Plastics
Textiles
Transportation Equipment
End Use Selection
Onsite Generation
Process Energy
Nonprocess Energy
Energy Type Selection
Fuel
Steam
Electricity
Applied Energy
Energy Lost
Other Systems
Compare Subsectors
Hover over a subsector below to see the share of energy consumed based on the selections above; less than 1% share are grouped with “Remaining Manufacturing".
Primary Energy: All Manufacturing 19,237 TBtu
Prepared for the U.S. Department of Energy's Advanced Manufacturing Office by Energetics Incorporated


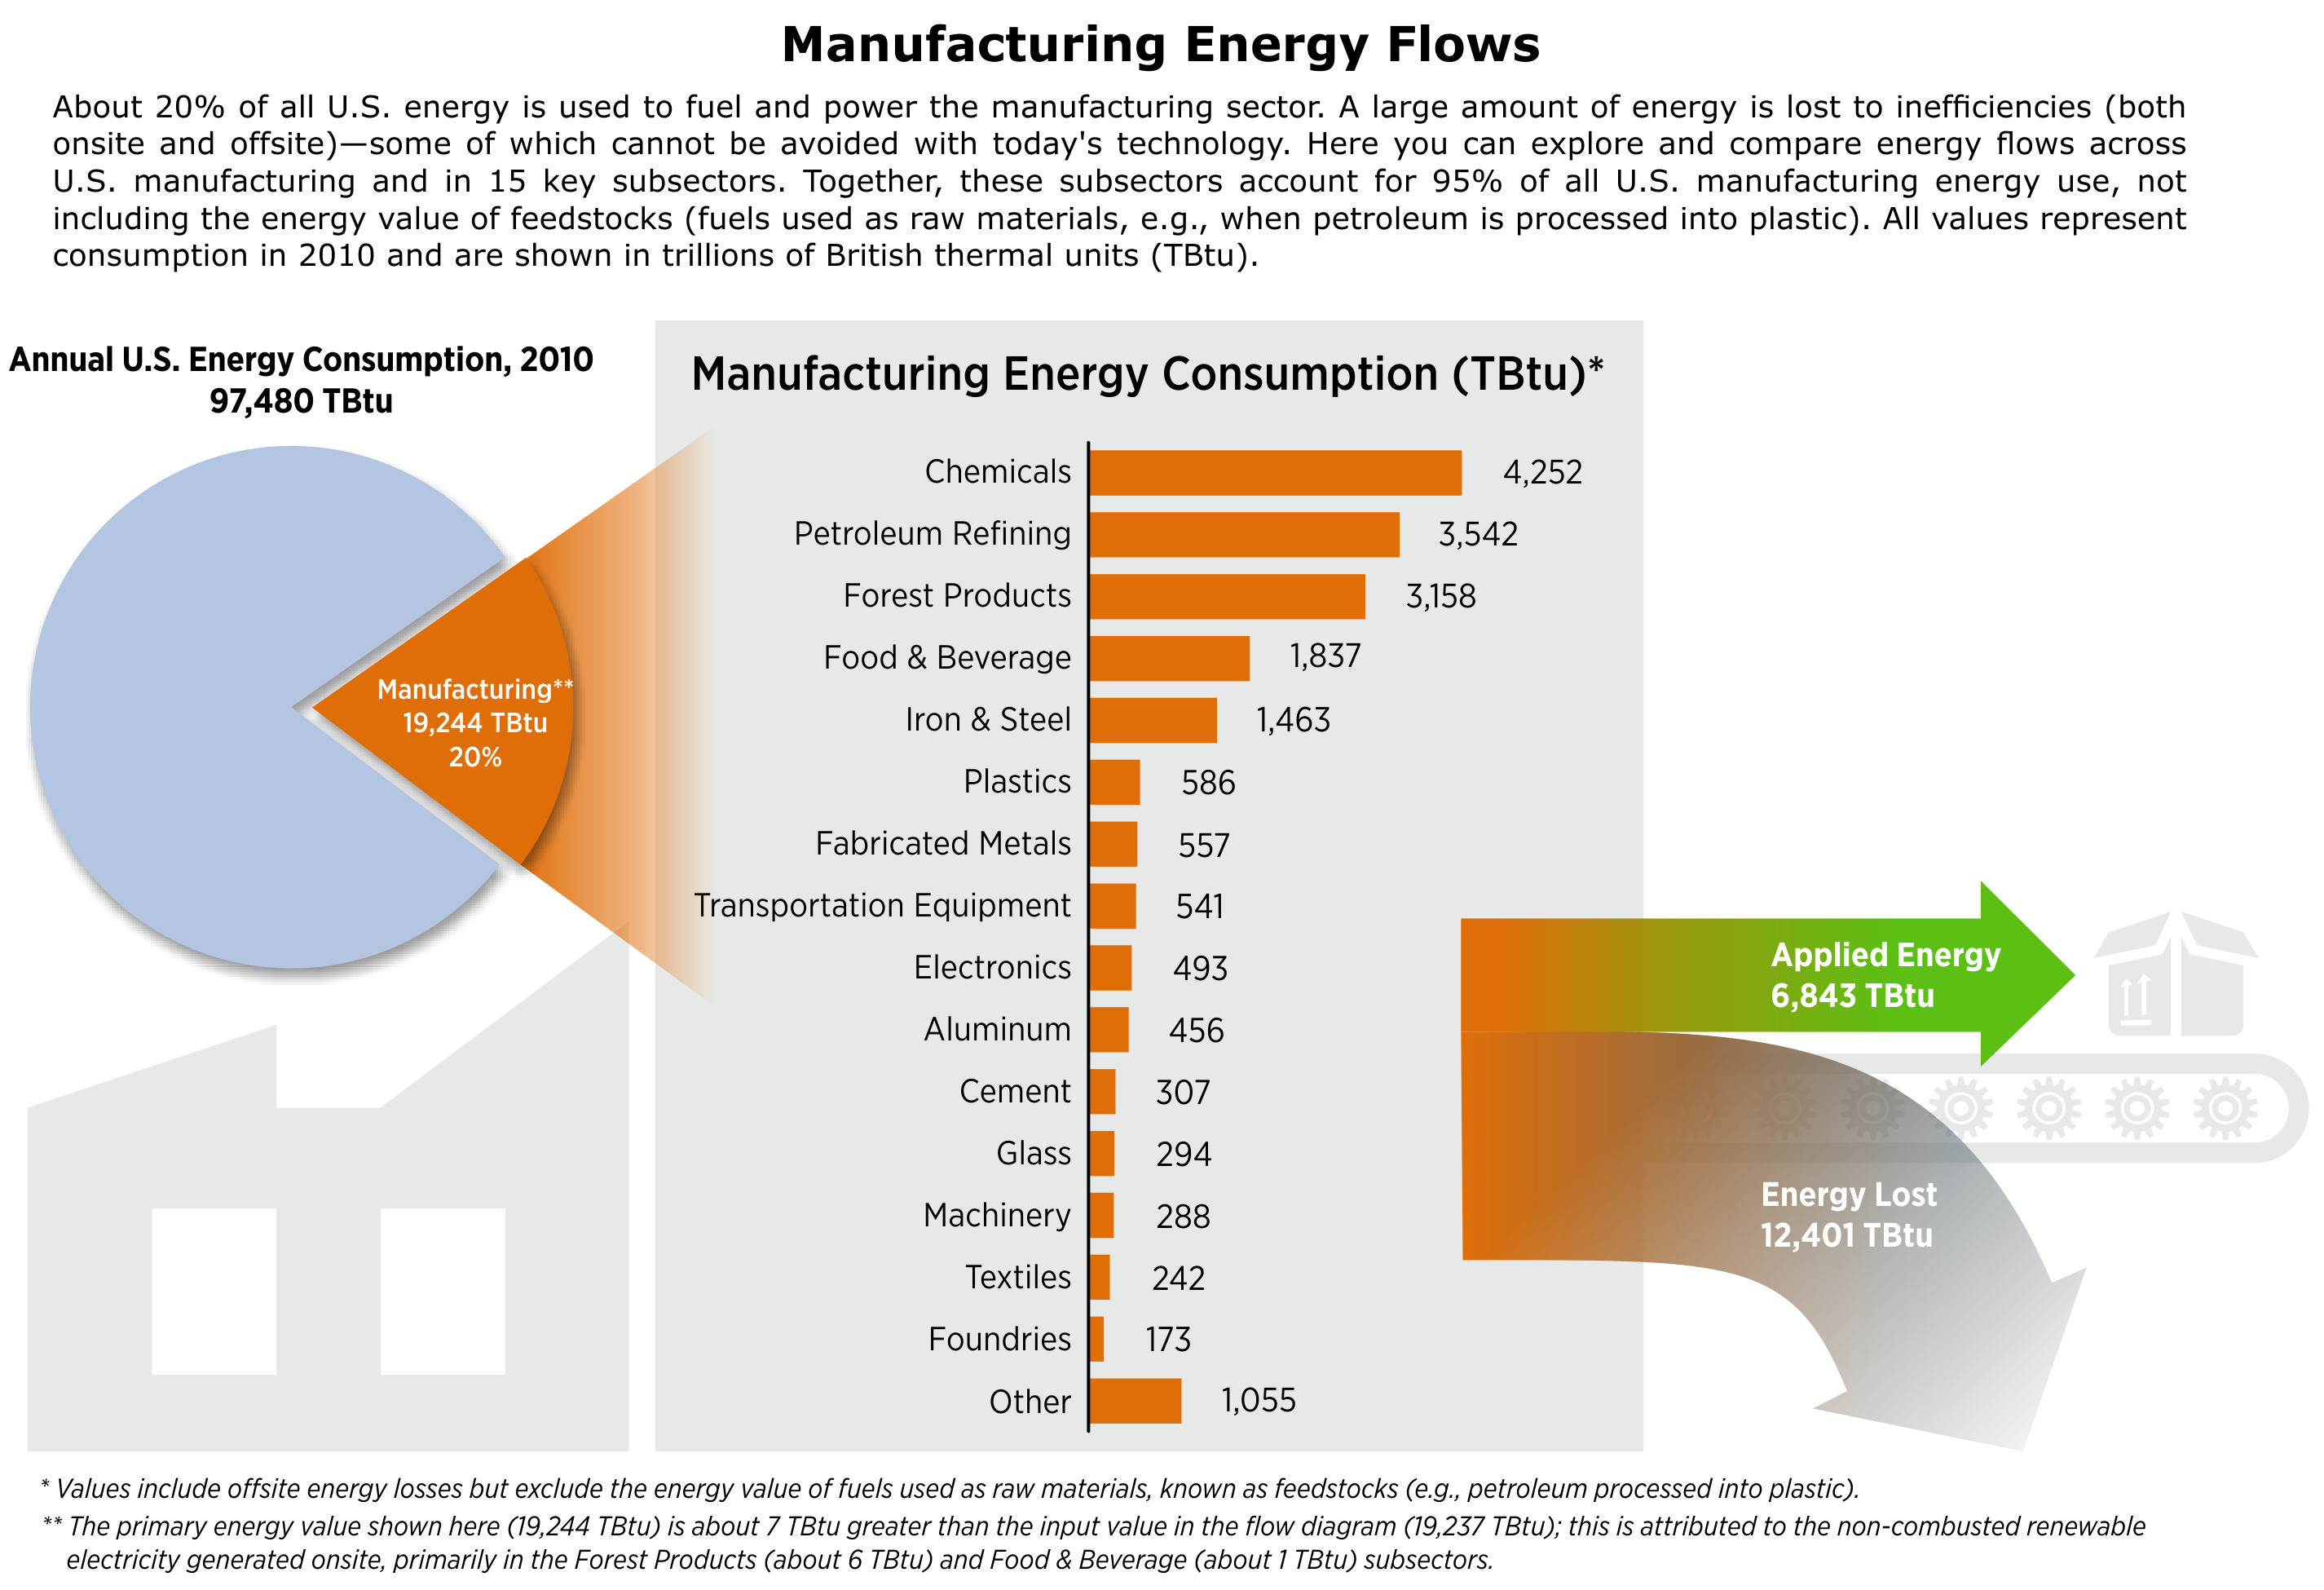
Manufacturing Energy Flows (in TBtu), 2010
Please visit this page from a desktop browser or tablet. This dynamic Sankey diagram can be used to explore (zoom, pan, select) and compare energy flows across U.S. manufacturing and key subsectors. Line widths indicate the volume of energy flow in trillions
of British thermal units (TBtu). The 15 manufacturing subsectors together consume 95% of all energy used by U.S. manufacturing, not including the energy value of fuels used as raw
materials (feedstocks). Data Source: Manufacturing Energy Footprints.