Maps and Data
Find maps and charts showing transportation data and trends related to alternative fuels and vehicles.
OR
-
-
Global Ethanol Production
Quantity of ethanol produced by country from 2007-2014 Last update March 2016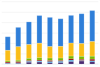
-
-
-
U.S. Production, Consumption, and Trade of Ethanol
Trend of total ethanol fuel production and consumption from 1981-2015 Last update September 2016
-
-
-
U.S. Total Corn Production and Corn Used for Fuel Ethanol Production
Trend of corn produced in U.S. and quantity used for ethanol from 1986-2016 Last update September 2016
-
-
-
U.S. Consumption of Ethanol and MTBE Oxygenates
Trend of ethanol and MTBE consumption as oxygenates and gasohol blends from 1978-2014 Last update April 2016
-
-
-
U.S. Ethanol Plants, Capacity, and Production
Trend of ethanol plant buildup from 2002-2014 Last update July 2015
-
-
-
Renewable Fuel RFS2 Mandates and RINs Generated
Last update February 2016
-
-
-
U.S. Life Cycle Greenhouse Gas Emissions of Biofuels
Comparison of greenhouse gas emissions from biofuels, developed by the EPA for Renewable Fuel Standard 2 rule Last update February 2010
-
-
-
Cellulosic RFS2 Mandates and RINs Generated
Last update February 2016
-
-
-
Carbon Intensity of Alternative Fuels in California Light-Duty Vehicles
California Low Carbon Fuel Program's assessment of lifecycle GHG emissions from alternative fuels Last update March 2011
-
-
-
Total Advanced RFS2 Mandates and RINs Generated
Last update February 2016
-
-
-
AFV Acquisitions by Regulated Fleets (by Fuel Type)
Trend of S&FP AFV acquisitions by fuel type from 1992-2015 Last update August 2016
-
-
-
Greenhouse Gas Emissions by Fuel Type
Life-cycle GHG emissions from different light-duty vehicle and fuel pathways Last update August 2015
-
-
-
Total RFS2 Mandates and RINs Generated
Last update February 2016
-
-
-
On-Road AFVs Made Available by Year
Trend of AFVs capable of using various fuels that were sold, leased, or converted from 1998-2012 Last update April 2013
-
-
-
U.S. Corn Productivity and Land Use
Trend of corn yield and acres of corn harvested from 1866-2014 Last update August 2015
-
-
-
Annual Percent Growth of Vehicles in Operation
Last update October 2016
-
-
-
Cost Components for Domestically Produced Food in 2013
Composition of the cost that consumers paid for farm foods in 2013 Last update August 2015
-
-
-
U.S. Corn Use by Market Year
Annual usage of the U.S. corn crop according to end product or destination Last update August 2015
-
-
-
U.S. Light-Duty Fuel Consumption and Vehicle Miles Traveled (VMT)
Trend of per capita VMT and fuel use in U.S. light-duty vehicles from 1970-2012 Last update July 2014
-
-
-
U.S. Soybean and Corn Prices
Trend of soybean and corn prices, adjusted for inflation, from 1866-2014 Last update August 2015
-
-
-
Average Vehicle Trip Length by Purpose
Average trip length and distribution by trip type in U.S., 2009 Last update May 2012
-
-
-
BioFuels Atlas
BioFuels Atlas is an interactive map for comparing biomass feedstocks and biofuels by location. This tool helps users select from and apply biomass data layers to a map, as well as query and download biofuels and feedstock data. The state zoom function summarizes state energy use and infrastructure for traditional and bioenergy power, fuels, and resources. The tool also calculates the biofuels potential for a given area. BioFuels Atlas was developed by the National Renewable Energy Laboratory with funding from the DOE Biomass Program.
-


Global Ethanol Production
| 2007 | 2008 | 2009 | 2010 | 2011 | 2012 | 2013 | 2014 | 2015 | |
| USA | 6.521 | 9.309 | 10.938 | 13.298 | 13.948 | 13.3 | 13.3 | 14.3 | 14.806 |
| Brazil | 5.0192 | 6.4722 | 6.578 | 6.92154 | 5.57324 | 5.577 | 6.267 | 6.19 | 7.093 |
| Europe | 0.5702999999999999 | 0.7336 | 1.04 | 1.20858 | 1.16764 | 1.179 | 1.371 | 1.445 | 1.387 |
| China | 0.486 | 0.5019 | 0.542 | 0.54155 | 0.55476 | 0.555 | 0.696 | 0.635 | 0.813 |
| Canada | 0.21130000000000002 | 0.2377 | 0.291 | 0.35663 | 0.4623 | 0.449 | 0.523 | 0.15 | 0.436 |
| Rest of World | 0.3153 | 0.3894 | 0.914 | 0.98461 | 0.69815 | 0.752 | 1.272 | 1.49 | 1.147 |
Source: Renewable Fuels Association
Notes: A more detailed breakdown of fuel ethanol production by country for 2000-2012 can be viewed at the EIA's International Energy Statistics: Biofuels Production.
This chart shows global ethanol production by country or region, from 2007 to 2015. Global production peaked in 2015 after a dip in 2012 and 2013. The United States is the world's largest producer of ethanol, having produced nearly 15 billion gallons in 2015 alone. Together, the U.S. and Brazil produce 85% of the world's ethanol. The vast majority of U.S. ethanol is produced from corn, while Brazil primarily uses sugar.
Print