Maps and Data - U.S. Alternative Fueling Stations by Fuel Type
Find maps and charts showing transportation data and trends related to alternative fuels and vehicles.
OR
Sort by:
130 results
-
Fuels & Infrastructure: Idle Reduction
-
-
Truck Stop Electrification Sites
Trend of TSE sites by state from 2006-2014 Last update August 2015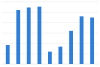
-
-
-
Truckstop Electrification Facilities
Last update May 2013
-
-
Fuels & Infrastructure: Emissions
-
-
U.S. Greenhouse Gas Emissions by Economic Sector
Last update August 2015
-
-
-
U.S. Life Cycle Greenhouse Gas Emissions of Biofuels
Comparison of greenhouse gas emissions from biofuels, developed by the EPA for Renewable Fuel Standard 2 rule Last update February 2010
-
-
Regulated Fleets: State & Alt Fuel Providers
-
-
Vehicle Credits Traded by Regulated Fleets
Trend of S&FP EPAct credits traded and transactions from 1997-2015 Last update August 2016
-

U.S. Alternative Fueling Stations by Fuel Type
| 1992 | 1993 | 1994 | 1995 | 1996 | 1997 | 1998 | 1999 | 2000 | 2001 | 2002 | 2003 | 2004 | 2005 | 2006 | 2007 | 2008 | 2009 | 2010 | 2011 | 2012 | 2013 | 2014 | 2015 | 2016 | |
| Electric* | 188 | 194 | 310 | 486 | 490 | 558 | 693 | 873 | 830 | 671 | 588 | 465 | 442 | 430 | 465 | 541 | 3394 | 13392 | 19410 | 25602 | 30945 | 42011 | |||
| Propane | 3297 | 3297 | 3299 | 3299 | 4252 | 4255 | 5318 | 4153 | 3268 | 3403 | 3431 | 3966 | 3689 | 2995 | 2619 | 2371 | 2175 | 2468 | 2647 | 2597 | 2654 | 2956 | 2931 | 3594 | 3665 |
| Methanol (M85) | 43 | 50 | 82 | 88 | 95 | 106 | 91 | 51 | 3 | ||||||||||||||||
| LNG | 72 | 71 | 66 | 46 | 44 | 44 | 36 | 62 | 58 | 40 | 37 | 35 | 38 | 36 | 39 | 45 | 59 | 81 | 103 | 111 | 140 | ||||
| Hydrogen | 7 | 7 | 9 | 14 | 17 | 32 | 46 | 63 | 58 | 56 | 58 | 53 | 51 | 39 | 54 | ||||||||||
| Biodiesel** | 2 | 16 | 79 | 142 | 176 | 304 | 459 | 742 | 645 | 679 | 644 | 627 | 675 | 757 | 783 | 721 | 697 | ||||||||
| CNG | 349 | 497 | 1042 | 1065 | 1419 | 1426 | 1268 | 1267 | 1217 | 1232 | 1166 | 1035 | 917 | 787 | 732 | 721 | 778 | 772 | 841 | 910 | 1107 | 1263 | 1495 | 1563 | 1725 |
| E85 | 2 | 7 | 32 | 37 | 68 | 71 | 40 | 49 | 113 | 154 | 149 | 188 | 200 | 436 | 762 | 1208 | 1644 | 1928 | 2142 | 2442 | 2553 | 2639 | 2840 | 2990 | 3090 |
Source: Alternative Fuels Data Center (AFDC), either directly (www.afdc.energy.gov/fuels/stations_counts.html) or from historical Transportation Energy Data Books (www.osti.gov/bridge/basicsearch.jsp)
Notes: Data snapshots for each year are based on the federal fiscal year and taken as close to September 30th of the indicated year as possible. All attempts were made to space data samples out one year. However, this was not always possible due to when the TEDB samples were taken. This caused the largest disturbance in 2004, when the sample was taken only five months after the 2003 sample. Therefore, data trends are understated between 2003 and 2004. See Refuel Stations by State for exact sampling dates.
This chart shows the trend of U.S. alternative fueling stations by fuel type from 1992 to 2016. Propane stations were the most numerous until 2011, when they were surpassed by electric vehicle supply equipment (EVSE), or charging units. The growth in EVSE units accelerated starting in 2011, following the 2010 increase of plug-in electric vehicles offered by major automakers. 2016 experienced the largest growth for EVSE in order to support the growing electric vehicle population. As the population of electric vehicles continues to increase, the demand to support with EVSE growth should do the same. The number of E85 stations has been increasing steadily since 2004, as the number of flex-fuel vehicles available from major manufacturers has increased. The number of CNG stations decreased between 1996 and 2007 (despite the increase in CNG sales during this time) largely because the average station size was increasing. The number of CNG stations then increased 2.4X between 2007 and 2016.
Station counts include both public and private stations.
* Starting in 2011, electric charge equipment was counted by the plug rather than by the geographical location. This is different than other fuels, which only count the geographical location regardless of how many dispensers or nozzles are on site.
** Stations selling low-level biodiesel blends (less than B20) are included in the station listing only for the years 2005-2007
*** Total is the total number of fuel types sold at stations. Stations are counted once for each type of fuel sold.
Print