‹ Analysis & Projections
Short-Term Energy Outlook
Release Date: December 6, 2016 | Next Release Date: January 10, 2017 | Full Report | Text Only | All Tables | All Figures
Coal
- Coal production in November 2016 was 70.7 million short tons (MMst), the third time this year monthly production exceeded 70 MMst. Monthly coal production exceeded 70 MMst nine times in 2015 and in every month in 2014. Forecast annual coal production declines by 15% to 758 MMst in 2016, which would be the lowest level of coal production since 1978. Coal production is forecast to increase by 2% in 2017.
- Despite recent increases in global coal prices, spot U.S. coal prices have remained unchanged for the past six weeks. The delivered coal price averaged $2.23/MMBtu in 2015. Forecast coal prices average $2.14/MMBtu in 2016 (a 4% decline) and $2.21/MMBtu in 2017 (a 3% increase).


| U.S. Coal Summary | ||||
|---|---|---|---|---|
| 2014 | 2015 | 2016 projected | 2017 projected | |
| Prices | (dollars per million Btu) | |||
| Electric Power Sector | 2.36 | 2.23 | 2.14 | 2.21 |
| Supply | (million short tons) | |||
| U.S. Coal Production | 1000.0 | 897.0 | 758.4 | 772.1 |
| Imports | 11.3 | 11.3 | 10.2 | 10.6 |
| Exports | 97.3 | 74.0 | 56.8 | 58.5 |
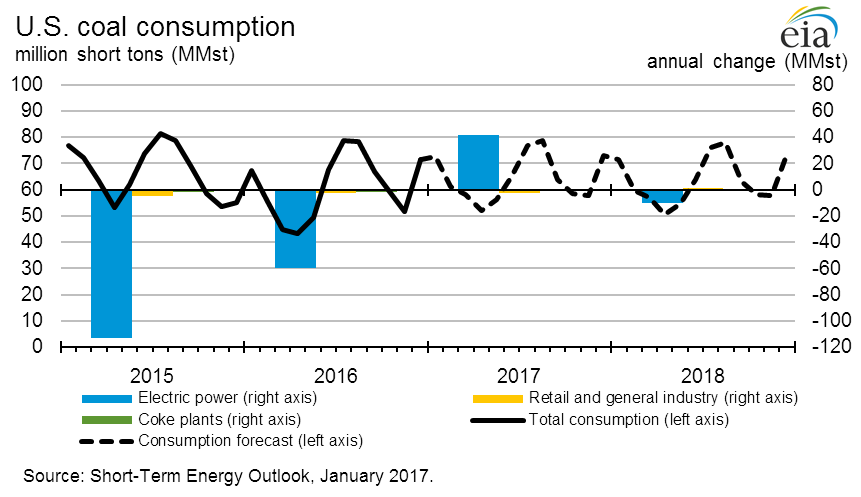
| Consumption | (million short tons) | |||
| Electric Power Sector | 851.6 | 738.4 | 680.9 | 700.9 |
| Other Sectors | 66.1 | 59.7 | 56.0 | 54.0 |
| Total Consumption | 917.7 | 798.1 | 736.8 | 754.9 |
| End of Period Inventories | (million short tons) | |||
| Electric Power Sector | 151.5 | 195.9 | 173.3 | 154.1 |
| Total Inventories | 197.7 | 238.8 | 215.3 | 194.9 |
Interactive Data Viewers
Provides custom data views of historical and forecast data
STEO Custom Table Builder ›
Real Prices Viewer ›
In beta testing:
STEO Data browser ›
| Related Articles | ||
|---|---|---|
| Today In Energy | Daily | |
| Energy-weighted industrial production indices | Mar-2014 |