GIS

Recognizing Winners of EPA’s Visualize Your Water Challenge

Washington-Lee Students Meet the Challenge

By Ryan Miller

Winning students Nicholas Oliveira and Anna Lujan with their teacher, Ryan Miller

Winning students Nicholas Oliveira (left) and Anna Lujan (right) with their teacher Ryan Miller (center)

I teach a class at Washington-Lee High School in Arlington, Virginia called Geospatial Tools and Techniques. It is a course designed to introduce high school students to geographic information systems (GIS) and is part of the James Madison University Geospatial Semester Program. All of my students are “dual-enrolled” and will be earning both high school and college credit.

GIS can be done using a variety of tools and methods, and as one of the assignments of my course this year, I decided to make the EPA Visualize Your Water Challenge a class project.

The Challenge asked contestants “to use open government data sources to create compelling, innovative, and comprehensible visualizations that inform individuals and communities about nutrient pollution and inspire them to reduce nutrient levels that cause algal blooms and hypoxia in local watersheds.

Preparing my students to work on this class project and to take on the challenge took several steps and involved several weeks of work in the classroom. Each student was to use their newly acquired GIS skills to submit entries into this government sponsored contest.

I first prepped the students by reviewing the causes, processes and impacts of nutrient pollution in waterways, something some of them were already familiar with from my environmental science class. We then transitioned into an examination of potential data needs and data sources to complete their work. Finally, we worked together to review the software skills needed.

The students aptly dove into this assignment, were able to identify fantastic open sources of government data (primarily relying upon U. S. Census and U.S. Agricultural Census data), and through minimal issues, acquired the needed software skills and set to work. The students all used an online GIS platform to complete their entries, ultimately generating “storymaps,” interactive web-based mapping applications. We were all pleased with the outcomes of this assignment, final products and grades included.

The efforts and storymaps of two of my students, Nicholas Oliveira and Anna Lujan, were fortunate to be recognized and were awarded the grand prize (Nicholas) and National Geographic Award (Anna)! Both students created well-designed functional projects that delve into nutrient pollution/eutrophication issues. I’m very proud of their efforts!

On Thursday April 21, officials from EPA, the GIS software company Esri, and other various sponsors and supporters of the Visualize Your Water Challenge visited Washington-Lee High School to celebrate and award Nicholas and Anna, and the other contestants. It was a fantastic way to bring students and experts in the field together to discuss and highlight the problems and issues of nutrient pollution/eutrophication. I’m grateful for this experience and I can state that my students are too.

About the Author: Ryan Miller teachers environmental studies and geospatial tools and techniques at Washington-Lee High School.


Dreams of a Teacher

By Ted Gardiner

Winning students and their teacher (left to right):

Winning students and their teacher (left to right): Clara Benadon, Alex Jin, Sam Hull, and Ted Gardiner

As a teacher within the Global Ecology Magnet Program at Poolesville High School, I was excited when the head of our program emailed me EPA’s Visualize Your Water Challenge.  Here at Poolesville High School our goal is to raise the environmental awareness of our students, so the Challenge resonated with our philosophy. It’s turned out to have a tremendous positive impact on our students.

The students really liked how the Challenge utilized StoryMaps to tackle the topic of nutrient pollution in the Chesapeake Bay Watershed, where we live.  The use of StoryMaps made the challenge fun and interactive.  This was the first time that our students used StoryMaps.  I was amazed at the interactivity and ease with which they were able to create meaningful artifacts.  Each day in our classroom students were able to have discussions with each other about how to present the information through StoryMaps, consistently pushing each other to go deeper into the issue.  As the days went on, they became more excited about how their work evolved.

All of the resources made available to the students were fantastic.  Students were able to use the websites provided through the EPA to learn more about nutrient pollution in the Chesapeake Bay and begin telling their interpretation of the story.  The Challenge engaged our students in critical thinking about the impact of nutrient pollution and how they could help in their own daily lives.

The Challenge gave students the opportunity to work with real data in an authentic process examining an issue within our own watershed.  As we neared the submission deadline, the class was so proud of what they had created that they did not discuss prizes, etc.  They were working as hard as they could to submit their StoryMaps and saw submission and the knowledge they had gained as the real prize for the project.  But they were in for a very pleasant surprise.

When we heard that we had two honorable mentions and the Chesapeake Bay winner, our students erupted into applause.  This was truly a moment that every teacher dreams of.

For the awards ceremony, EPA was very generous sending out a member of their science communication team to Poolesville High School as we remotely participated.  The students and their parents were so proud, another moment that every teacher dreams of.

Giving students this opportunity and recognition is priceless in our ever changing technological world.  Overall, this project gave our students an opportunity to be excited about learning and utilizing technology to tell a story that more people need to hear.  In the end, the Visualize Your Water Challenge delivered so many educational positives for our students. I want to thank the EPA and Challenge.gov for making this project so accessible and fantastic.

About the Author: Ted Gardiner is a teacher in the Global Ecology Magnet Program at Poolesville High School in Montgomery County, MD.

Editor's Note: The opinions expressed herein are those of the author alone. EPA does not verify the accuracy or science of the contents of the blog, nor does EPA endorse the opinions or positions expressed. You may share this post. However, please do not change the title or the content. If you do make changes, please do not attribute the edited title or content to EPA or the author.

EPA's official web site is www.epa.gov. Some links on this page may redirect users from the EPA website to a non-EPA, third-party site. In doing so, EPA is directing you only to the specific content referenced at the time of publication, not to any other content that may appear on the same webpage or elsewhere on the third-party site, or be added at a later date.

EPA is providing this link for informational purposes only. EPA cannot attest to the accuracy of non-EPA information provided by any third-party sites or any other linked site. EPA does not endorse any non-government websites, companies, internet applications or any policies or information expressed therein.

Take Cover! (With Vegetation)

By Marguerite Huberbuffer

Take cover!

It’s a phrase you yell to protect against something headed your way. But did you ever think that phrase could be applied to pollutants? Well, it can – vegetative cover acts as a defense against non-point source (NPS) pollutants, protecting our lakes, streams, and water bodies.

Vegetative filter strips and riparian buffers  are conservation practices that help control the amount of sediment and chemicals that are transported from agricultural fields into water bodies. They slow down the speed of runoff and capture nutrients, keep more nutrient-rich topsoil on farmers’ fields, and reduces impacts on downstream ecosystems.

To improve water quality in large watersheds, conservation managers need to know what the problems are, where the pollutants originate, and what conservation practices work best.  However, investigating all of these factors at the watershed-wide level is a very difficult and complex task. This is why EPA is working with partners to supplement an existing watershed simulation model to estimate the efficiency of riparian buffers.

USDA’s watershed simulation model, Annualized Agricultural Non-Point Source Pollution (AnnAGNPS), is used to evaluate the effect of farming and conservation practices on pollutants and help decide where to put these practices.  AnnAGNPS also predicts the origin and tracks the movement of water, sediment, and chemicals to any location in the watershed.

To supplement this model, researchers from EPA, USDA, and Middle Tennessee State University developed a Geographic Information Systems–based technology that estimates the efficiency of buffers in reducing sediment loads at a watershed scale.

With the addition of this AGNPS Buffer Utility Feature  technology to the USDA model, researchers and watershed conservation managers can evaluate the placement of riparian buffers, track pollution loads to their source, and assess water quality and ecosystem services improvements across their watersheds.

Riparian buffers and other vegetative cover, such as filter strips, are considered an important, effective, and efficient conservation practice that has been shown to protect ecosystem services at a local level. However, their full impact on a watershed-scale is still subject to ongoing research.


About the Author: Marguerite Huber is a Student Contractor with EPA’s Science Communications Team.

Editor's Note: The opinions expressed herein are those of the author alone. EPA does not verify the accuracy or science of the contents of the blog, nor does EPA endorse the opinions or positions expressed. You may share this post. However, please do not change the title or the content. If you do make changes, please do not attribute the edited title or content to EPA or the author.

EPA's official web site is www.epa.gov. Some links on this page may redirect users from the EPA website to a non-EPA, third-party site. In doing so, EPA is directing you only to the specific content referenced at the time of publication, not to any other content that may appear on the same webpage or elsewhere on the third-party site, or be added at a later date.

EPA is providing this link for informational purposes only. EPA cannot attest to the accuracy of non-EPA information provided by any third-party sites or any other linked site. EPA does not endorse any non-government websites, companies, internet applications or any policies or information expressed therein.

Environmental Impact Statements Are on the Map!

By Aimee Hessert

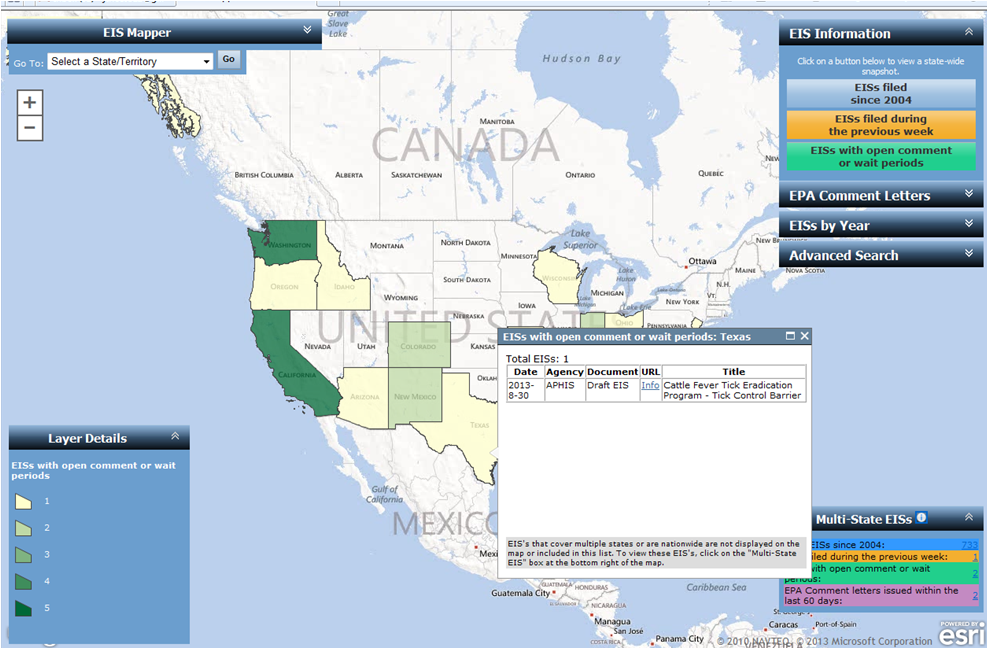
Do you ever wonder how a proposed project will affect the environment where you and your family live, work and play? We’re making it easier to find out. We’ve developed a simple, interactive map to help you learn about environmental impact statements in your area.

The National Environmental Policy Act (NEPA) requires federal agencies proposing major projects or making decisions on major federal actions to develop environmental impact statements (EIS), which describe the potential environmental effects (both good and bad) of proposed projects that require federal approval, or other federal actions. The idea is to give you a view into, and a voice in, the federal agency decision-making process.

The map allows you to see what projects have EISs that are currently open for public review and comment, while also viewing EPA’s comments. Now it’s easier for local residents to access valuable information, stay informed and get involved, right at their fingertips.

Take a few minutes to check out the EIS Mapper. All you need to do is hover your mouse over your home state for easy-to-understand information about projects that may affect you. From there, you can review each project’s environmental impact statement and find out how to share your thoughts while the comment period is open.

In this information technology age, transparency empowers progress. Stay informed and get involved.

Check out EPA’s EIS Mapper here: http://eismapper.epa.gov.

EPA's Environmental Impact Statements by State Mapper

EPA’s Environmental Impact Statements by State Mapper


Aimee Hessert is the Deputy Director of EPA’s NEPA Compliance Division.  She has worked on GIS and IT initiatives for EPA’s NEPA program since 2004.

Learn More!:  The web-based mapping tool, NEPAssist is designed to help promote collaboration and early involvement in the NEPA process by allowing the user to raise and identify important environmental issues at the earliest stages of project development.  Read the full blog post here.

Editor's Note: The opinions expressed herein are those of the author alone. EPA does not verify the accuracy or science of the contents of the blog, nor does EPA endorse the opinions or positions expressed. You may share this post. However, please do not change the title or the content. If you do make changes, please do not attribute the edited title or content to EPA or the author.

EPA's official web site is www.epa.gov. Some links on this page may redirect users from the EPA website to a non-EPA, third-party site. In doing so, EPA is directing you only to the specific content referenced at the time of publication, not to any other content that may appear on the same webpage or elsewhere on the third-party site, or be added at a later date.

EPA is providing this link for informational purposes only. EPA cannot attest to the accuracy of non-EPA information provided by any third-party sites or any other linked site. EPA does not endorse any non-government websites, companies, internet applications or any policies or information expressed therein.

NEPAssist: One of EPA’s Newest Geospatial Tools

By Amber Tucker

Hi all, this is my first attempt at the blogging world, so please bear with me.  I initially started out intending to major in Journalism so maybe this won’t be as mighty of a feat as I’ve imagined it to be.  Even though I still do enjoy journaling in my personal time, my passion for career choice took a turn in my second semester of college.  It was in a requisite biology course that I took greater notice of and fell in love with wildlife, nature, and the great outdoors.  This led to a change in majors to Environmental Science which in turn, led me to the most amazing workplace I never dreamt I would get to be a part of; EPA.  Since day one, I’ve never stopped learning, and along the way, I’ve had the pleasure of being exposed to and able to utilize some of the most progressive scientific advances.

I think we can all agree that technology is pretty amazing these days; through the remarkable technology of public GIS platforms like Google Earth, you have the ability to essentially tour the world from the comfort of your own living room.  In the words of the late, great Dr. Seuss…”Oh the places you’ll go.”  Well, if you’re like me, with the world at your fingertips and the possibilities endless, the first place you decide to visit…an aerial view of your own home.  Exotic destination, no doubt.  However, there’s certainly some value in checking out your own neighborhood from a different point of view.  It’s good to know what all encompasses your surrounding areas.  You may discover things you never knew about the places you see every day.

EPA has rolled out some new technology that allows you to do just that; spatially discover the world around you, from an environmental perspective. Previously only accessible to EPA employees and contractors, NEPAssist is now available to everyone wanting to take a look at environmental factors and conditions in any given area throughout the country.  A web-based mapping tool, NEPAssist is designed to help promote collaboration and early involvement in the NEPA process by allowing the user to raise and identify important environmental issues at the earliest stages of project development.

The National Environmental Policy Act (NEPA) of 1970 requires all federal agencies to incorporate environmental considerations in their planning and decision-making through a systematic interdisciplinary process. NEPAssist is designed to help promote collaboration and early involvement in the NEPA process by raising important environmental issues at the primary stages of project development. The mapping tool can be used by Federal agencies to identify alternative project locations, to avoid and minimize impacts, as well as identify potential mitigation areas. It’s a tool that can also help citizens to be aware of and involved in environmental decisions that affect their community.

NEPAssist draws information from publicly available federal, state, and local datasets, allowing NEPA practitioners, stakeholders and the public to view information about environmental conditions within the area of a proposed project quickly and easily at early stages of project development. There’s information on regulated facilities, demographics, water features, historic places, threatened & endangered species, wetlands, and so much more! You can trust me on this, or you can check it out for yourself (even though I assure you I’m trustworthy, I’d go with the latter).

The thought behind this is that NEPAssist could serve as an essential “one-stop shop” to garner environmental information for your desired vicinity.  NEPAssist also houses EJView data, formerly known as the Environmental Justice Geographic Assessment Tool, which is a mapping tool that allows users to create maps and generate detailed reports based on the geographic areas and data sets they choose.  Similar to the likes of Google Maps or Bing Maps, NEPAssist offers a variety of viewing options; Road, Aerial, and in some of the more urban areas, Birds Eye view.  I have to admit, the clarity and close-up image that Birds Eye view affords simultaneously amazes and freaks me out a little; I think I can see my dad’s pickup truck parked in my driveway!


A really cool feature of NEPAssist is the ability for you to define an area and then generate a detailed environmental report for that area. Using this tool, you can draw a point, line, area, or rectangle. You can also specify a buffer area radius for which the report will be generated. Draw your desired area, hit the NEPAssist Report button, and voila! You have yourself an environmental snapshot report. Information in the report will be displayed as a series of questions with yes or no answers based on the location of your project area. Click on a hyperlinked question to view the data source and associated metadata. All of this data, historical and current, available to you with just the push of a button.


This is the same primary and first-line tool we at EPA use to evaluate projects and generate comments. To access this tool and to learn more about NEPAssist and how it can aid you in your NEPA work, please visit the public NEPAssist website at http://www.epa.gov/compliance/nepa/nepassist-mapping.html.  Here you will also find a link to a NEPAssist Demonstration Webinar, as well as other NEPAssist user resources.  EPA is continually striving to enhance the NEPAssist tool to facilitate more efficient and effective federal environmental reviews and project planning.

Pretty neat, right?  I’m all about making well-informed decisions and I appreciate that NEPAssist allows me to become more aware of the environmental conditions and features in my backyard, my neighborhood, my community, my state, and my nation. Today, my cul-de-sac. Tomorrow, the world! Check out our NEPAssist page and create your own environmental knowledge quest.

Amber Tucker is an Environmental Scientist who serves as a NEPA reviewer for EPA Region 7.  She is a graduate of Haskell University and serves as Region 7’s Special Emphasis Program Manager for Native American Employment Programs.

Editor's Note: The opinions expressed herein are those of the author alone. EPA does not verify the accuracy or science of the contents of the blog, nor does EPA endorse the opinions or positions expressed. You may share this post. However, please do not change the title or the content. If you do make changes, please do not attribute the edited title or content to EPA or the author.

EPA's official web site is www.epa.gov. Some links on this page may redirect users from the EPA website to a non-EPA, third-party site. In doing so, EPA is directing you only to the specific content referenced at the time of publication, not to any other content that may appear on the same webpage or elsewhere on the third-party site, or be added at a later date.

EPA is providing this link for informational purposes only. EPA cannot attest to the accuracy of non-EPA information provided by any third-party sites or any other linked site. EPA does not endorse any non-government websites, companies, internet applications or any policies or information expressed therein.

Career Advice from Paisly

By: Kelly Siegel

I am currently taking a GIS class as part of my Masters program.  I am learning so many GIS skills, I decided to sit down with GIS Specialist, Paisly Di Bianca, turn learn how these skills could turn into a career.  After hearing more about Paisly’s career, I decided to take an intermediate GIS course next semester!

What is your position at the EPA?

I am a GIS Specialist. GIS is Geographic Information Systems. It is used to analyze and display spatial data.

What is a typical day like for you?

I don’t have a typical day! One day I might be giving a training class on GIS, another I might be making a map to support another program or division.  This week, for example, I am correcting areas in a database of visited facilities.  This is a resource available to the public. 

What is the best part of your job?

I get to do what I studied in school every day – not everyone gets to do that!  When working with maps and geography I get to be creative and problem solve. 

Did you always have an interest in the environment?

I was always eco-conscious: I reduce/reuse/recycle, take public transportation as often as I can, ride my bike, buy recycled paper products, encourage my friends to do the same. Growing up in the 70’s, living the green life was almost inherit.  We knew the environment was important. 

What classes did you take in school that you use on the job today?

I have a certificate in GIS, which means I took 5 classes on different areas of GIS.  I am also finishing a masters degree in Geography and Environmental Studies.  Some specific classes I took and utilize include GIS for the Natural Environment and an Interactive Mapping class – this deals with websites with maps. 

Do you have any advice for kids today who have an interest in protecting our environment?

Study geography!  Embrace science and computers – don’t be afraid of them!  Think about all the maps you see today – they are all made on a computer. 

Kelly Siegel is a student volunteer in the EPA’s Air and Radiation Division in Region 5, and is currently obtaining her Master’s degree in Urban Planning and Policy at the University of Illinois at Chicago.  She has a passion for sustainable development, running, and traveling with friends

Editor's Note: The opinions expressed herein are those of the author alone. EPA does not verify the accuracy or science of the contents of the blog, nor does EPA endorse the opinions or positions expressed. You may share this post. However, please do not change the title or the content. If you do make changes, please do not attribute the edited title or content to EPA or the author.

EPA's official web site is www.epa.gov. Some links on this page may redirect users from the EPA website to a non-EPA, third-party site. In doing so, EPA is directing you only to the specific content referenced at the time of publication, not to any other content that may appear on the same webpage or elsewhere on the third-party site, or be added at a later date.

EPA is providing this link for informational purposes only. EPA cannot attest to the accuracy of non-EPA information provided by any third-party sites or any other linked site. EPA does not endorse any non-government websites, companies, internet applications or any policies or information expressed therein.

GIS Data in Iowa — Big (12) Data

By Casey J. McLaughlin

We are well past the “Bowl Season” and March Madness is right around the corner; it is past time we look at some great data sources from the Hawkeye State (sorry Cyclones, that’s what Wikipedia calls it!).  In the past, I would start looking for specific data using a general search engine but today, Iowa.gov is a great entry point for all Iowa data.  I will highlight a few that I have found the most useful.

The Iowa Geographic Map Server housed at Iowa State (Go Cyclones!) serves a fantastic range of aerial imagery products including images from the today to the 1930’s!  The images can be viewed online through their web viewer, downloaded, or consumed directly.  The variety of imagery available is amazing (I might have said that already) but I’m excited that it is available to use directly or downloadable giving users to choose what they need.  I have not had occasion to use the Iowa Historic Vegetation map but how great is having data from 1832-1859 available??

The Natural resources Geographic Information is brought to you by the Iowa Department of Natural Resources and housed at the University of Iowa (home of the Hawkeyes whom, I must note, reside in the Big 10 conference but they currently have 12 members).  The NRGIS is organized with counties in mind as data can be searched and retrieved not only by general theme, but also by county.  If I need GIS data for a county, this is where I start, especially since they’ve already clipped all of the data.  I am intrigued by historical imagery and have really enjoyed using the Andreas 1875 historical atlas data.  You can also view the maps courtesy of the David Rumsey Collection.

Map of Humboldt County, State of Iowa. (Published by the Andreas Atlas Co., Lakeside Building, Chicago, Ills. Engraved & printed by Chas. Shober & Co., Props. of Chicago Lithographing Co.) 1875. Hosted by the David Rumsey Collection

Iowa has strongly supported the public distribution of their data and they have lot of great data out there, what are your favorite Iowa GIS data sets?  Are there other sources you’d recommend?

Casey McLaughlin is a first generation Geospatial Enthusiast who has worked with EPA since 2003 as a contractor and now as the Regional GIS Lead. He currently holds the rank of #1 GISer in EPA Region 7′s Environmental Services Division.

Editor's Note: The opinions expressed herein are those of the author alone. EPA does not verify the accuracy or science of the contents of the blog, nor does EPA endorse the opinions or positions expressed. You may share this post. However, please do not change the title or the content. If you do make changes, please do not attribute the edited title or content to EPA or the author.

EPA's official web site is www.epa.gov. Some links on this page may redirect users from the EPA website to a non-EPA, third-party site. In doing so, EPA is directing you only to the specific content referenced at the time of publication, not to any other content that may appear on the same webpage or elsewhere on the third-party site, or be added at a later date.

EPA is providing this link for informational purposes only. EPA cannot attest to the accuracy of non-EPA information provided by any third-party sites or any other linked site. EPA does not endorse any non-government websites, companies, internet applications or any policies or information expressed therein.

Moving the Arch

By Casey J. McLaughlin

Remotely sensed data is a popular background for many maps today, but it isn’t all just a pretty picture.  Images produced by satellite or airplane get processed and circulated at a very fast pace – everyone wants the latest and greatest.  Speed often means ortho-rectification isn’t a high priority.  Wikipedia gives a simple write up of the process:

An orthophoto, orthophotograph or orthoimage is an aerial photograph geometrically corrected (“orthorectified”) such that the scale is uniform: the photo has the same lack of distortion as a map. Unlike an uncorrected aerial photograph, an orthophotograph can be used to measure true distances, because it is an accurate representation of the Earth’s surface, having been adjusted for topographic relief,[1] lens distortion, and camera tilt.

Geospatial data can be a little more complicated than just having a latitude and longitude.  We model the earth in two-dimensional space (the globe is an imperfect sphere) and we’re still relying on planar map views (flat) even on our screens of choice.  Geospatial data should, therefore, contain good information about how that locational data (e.g. latitude and longitude) is collected and stored.  I’ve commented previously on the challenges of managing spatial data (datums, cell vs gps, projections, field data) and now I present, “The Case of the Moving Arch.”

A few summers ago we visited the Gateway Arch in St. Louis, Missouri.  After dipping my foot into the Mississippi, we ran around on the grounds of the park.  It’s a great monument although I confess I didn’t take the long and cramped ride to the top.  After my stroll through memory lane, I got back to thinking about imagery and plotted a reference point.  The graphic below shows a few years as seen using Google Earth’s historical imagery catalogue – as far as I can tell GE is still the best place for doing this exercise.

Nostalgia and the joy of Google Earth aside, notice how the arch “moves” in the images!  In both the 2011 images the Arch run south into the 2011 portion of my label.  August might have fewer letters than September or November, but the Arch is clearly running off the picture well to the left/east of the image!

Are you amazed yet?  I would hope not but thought I would check.  I saw the impact of this image distortion when I was reviewing some images with an inspector plotting some of his photographs onto a map using aerial imagery (the photos were geotagged with a lat/lon).   For this particular facility there were several images taken from a catwalk.  He placed the image location point onto a map (not Google in this case, FYI) and the location was definitely not on the cross-walk (more like walking on air).  Eventually, we found a satisfactory picture for the report but I’m left wondering if I had taken a photograph and not geotagged it in the field, which image could I use for adding an accurate latitude/longitude?

Normal-color kite aerial photograph of the upland study forest, Fort Leavenworth, Kansas, May 2000. Oblique view toward the south shows a fully developed forest canopy. Kansas Geological Survey Current Research in Earth Sciences, Bulletin 248, Part 1

Perhaps I’m getting into geography minutia, but there is more and more finer resolution imagery available than ever before.  Satellites and planes and kites (yes, kites) are acquiring imagery faster and finer (gigapixels!) and this trend will only continue.  In the movie “Enemy of the State” Will Smith’s character (Robert Dean) is tracked in real-time by satellite (drone maybe, but satellite?!?).  If we envision using remotely sensed imagery with such detail (seeing a dime on the street is another example) then knowing the distortion and resulting precision/accuracy seems rather important.

Casey McLaughlin is a first generation Geospatial Enthusiast who has worked with EPA since 2003 as a contractor and now as the Regional GIS Lead. He currently holds the rank of #1 GISer in EPA Region 7′s Environmental Services Division.

Editor's Note: The opinions expressed herein are those of the author alone. EPA does not verify the accuracy or science of the contents of the blog, nor does EPA endorse the opinions or positions expressed. You may share this post. However, please do not change the title or the content. If you do make changes, please do not attribute the edited title or content to EPA or the author.

EPA's official web site is www.epa.gov. Some links on this page may redirect users from the EPA website to a non-EPA, third-party site. In doing so, EPA is directing you only to the specific content referenced at the time of publication, not to any other content that may appear on the same webpage or elsewhere on the third-party site, or be added at a later date.

EPA is providing this link for informational purposes only. EPA cannot attest to the accuracy of non-EPA information provided by any third-party sites or any other linked site. EPA does not endorse any non-government websites, companies, internet applications or any policies or information expressed therein.

EnviroFacts/Window to my Environment

About the author: Kim Blair is currently an intern with Environmental Education and Indoor Air Programs in Region 5. She has an extensive environmental education background and is enjoying utilizing her previous experience at the EPA. She has been working with the EE coordinator on facilitating grants and the Web Workgroup along with getting hands on experience working on a geographic initiative in Northeast Indiana with the Indoor Air Programs.

When I was in high school I spent a lot of time doing research for different projects from history to chemistry. There was always some project that I was struggling to finish or striving to think of a way to make my research stand out to the teacher. Well, the EPA has a great tool to impress your teachers and to get information you didn’t think was even out there. It’s called EnviroFacts. Besides the flashy name – it’s ok to admit that you think it is a pretty cool name too – there are so many interactive things that this program can do. Visit http://www.epa.gov/enviro/ to get started exploring this newly updated program.

So what exactly is EnviroFacts? It’s a program that maps your area of choice with specific details about water quality, hazardous waste, air and land toxics, compliance issues and more. The tool is based on GIS (Geographic Information Systems) where data that is collected is input into a visual format like a map. You can customize what type of information you would like to display on your map or even map by topic instead of location to learn more about that issue. You can also share this site with your friends over Facebook, Stumbleupon and other social networks.

Here’s a sample of a map I looked up by zip code to get even more specific data displayed using the Enviromapper and Window to My Environment. I mapped the Lincoln Park neighborhood in Chicago to see what kinds of environmental impacts are important to the area. You can modify your map according to your area of interest and find out a lot about that area besides just the hazardous waste sites. You can also obtain facility information for potential or current pollution issues.

Sample map and legend from GIS

The possibilities are endless as you explore your world on a different level. This resource can be used for school or for your own personal interests. Maybe it could lead to community service projects based on the pollution issues in your area or a great visual for a class project. You can also take a look at the Community Service Projects page on EPA’s High School Website or just see the resources out there for you to use.

Editor's Note: The opinions expressed herein are those of the author alone. EPA does not verify the accuracy or science of the contents of the blog, nor does EPA endorse the opinions or positions expressed. You may share this post. However, please do not change the title or the content. If you do make changes, please do not attribute the edited title or content to EPA or the author.

EPA's official web site is www.epa.gov. Some links on this page may redirect users from the EPA website to a non-EPA, third-party site. In doing so, EPA is directing you only to the specific content referenced at the time of publication, not to any other content that may appear on the same webpage or elsewhere on the third-party site, or be added at a later date.

EPA is providing this link for informational purposes only. EPA cannot attest to the accuracy of non-EPA information provided by any third-party sites or any other linked site. EPA does not endorse any non-government websites, companies, internet applications or any policies or information expressed therein.