|
Download Data (XLS File) |
|
||||||||
|
||||||||
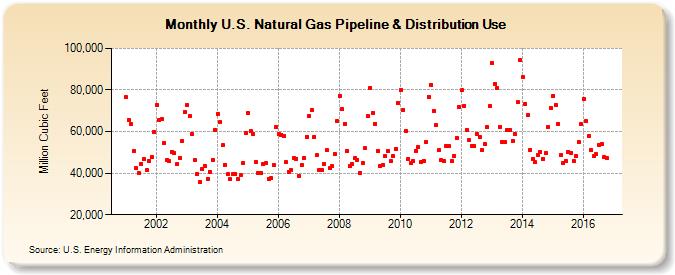
| U.S. Natural Gas Pipeline & Distribution Use (Million Cubic Feet) | ||||||||
| Year | Jan | Feb | Mar | Apr | May | Jun | Jul | Aug | Sep | Oct | Nov | Dec |
|---|---|---|---|---|---|---|---|---|---|---|---|---|
| 2001 | 76,386 | 65,770 | 63,626 | 50,736 | 42,238 | 40,041 | 44,518 | 46,609 | 41,497 | 45,967 | 47,630 | 59,946 |
| 2002 | 72,857 | 65,626 | 65,870 | 54,441 | 46,147 | 45,601 | 50,359 | 49,635 | 44,256 | 47,265 | 55,394 | 69,469 |
| 2003 | 72,816 | 67,462 | 58,692 | 46,108 | 39,657 | 35,652 | 42,107 | 43,482 | 37,347 | 40,742 | 46,462 | 60,963 |
| 2004 | 68,605 | 64,405 | 53,307 | 43,947 | 39,356 | 37,031 | 39,651 | 39,477 | 37,067 | 38,942 | 44,990 | 59,411 |
| 2005 | 68,889 | 60,200 | 58,871 | 45,564 | 39,863 | 40,242 | 44,485 | 44,721 | 37,415 | 37,443 | 43,968 | 62,367 |
| 2006 | 58,834 | 58,490 | 57,677 | 45,145 | 40,665 | 41,391 | 47,255 | 47,038 | 38,844 | 43,924 | 47,451 | 57,501 |
| 2007 | 67,439 | 70,273 | 57,526 | 48,595 | 41,342 | 41,310 | 44,231 | 50,914 | 42,286 | 43,236 | 49,140 | 65,072 |
| 2008 | 77,313 | 70,698 | 63,850 | 50,623 | 43,282 | 44,156 | 47,092 | 46,361 | 40,239 | 45,052 | 51,903 | 67,386 |
| 2009 | 81,144 | 69,119 | 63,814 | 50,684 | 43,256 | 44,075 | 48,056 | 50,455 | 45,621 | 48,298 | 51,782 | 73,871 |
| 2010 | 79,950 | 70,460 | 60,147 | 46,922 | 44,635 | 45,728 | 50,825 | 52,357 | 45,244 | 45,889 | 55,118 | 76,849 |
| 2011 | 82,626 | 69,965 | 62,944 | 50,979 | 46,204 | 46,037 | 52,900 | 52,896 | 45,927 | 48,362 | 56,945 | 72,000 |
| 2012 | 79,832 | 72,395 | 60,866 | 55,702 | 53,175 | 53,145 | 59,038 | 57,210 | 51,204 | 53,921 | 62,107 | 72,195 |
| 2013 | 93,018 | 82,890 | 80,940 | 62,329 | 54,947 | 54,767 | 60,741 | 60,785 | 55,518 | 58,737 | 74,032 | 94,357 |
| 2014 | 86,069 | 73,402 | 67,924 | 51,310 | 46,987 | 45,272 | 48,869 | 50,302 | 46,966 | 49,702 | 62,258 | 71,090 |
| 2015 | 77,286 | 72,676 | 63,664 | 48,718 | 44,775 | 46,047 | 50,297 | 49,895 | 46,040 | 48,161 | 55,028 | 63,626 |
| 2016 | 75,671 | 64,944 | 57,718 | 51,075 | 48,210 | 49,005 | 53,543 | 54,129 | 47,749 | 47,059 | ||
| - = No Data Reported; -- = Not Applicable; NA = Not Available; W = Withheld to avoid disclosure of individual company data. |
| Release Date: 12/30/2016 |
| Next Release Date: 01/31/2017 |