|
Download Data (XLS File) |
|
||||||||
|
||||||||
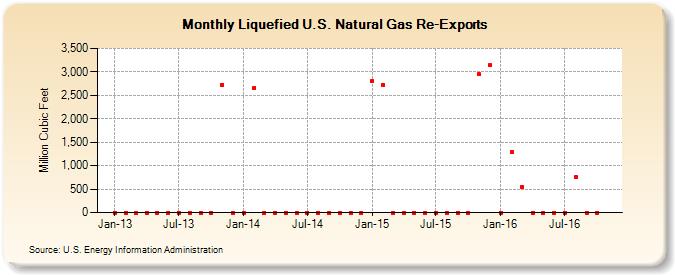
| Liquefied U.S. Natural Gas Re-Exports (Million Cubic Feet) | ||||||||
| Year | Jan | Feb | Mar | Apr | May | Jun | Jul | Aug | Sep | Oct | Nov | Dec |
|---|---|---|---|---|---|---|---|---|---|---|---|---|
| 2013 | 0 | 0 | 0 | 0 | 0 | 0 | 0 | 0 | 0 | 0 | 2,725 | 0 |
| 2014 | 0 | 2,664 | 0 | 0 | 0 | 0 | 0 | 0 | 0 | 0 | 0 | 0 |
| 2015 | 2,805 | 2,728 | 0 | 0 | 0 | 0 | 0 | 0 | 0 | 0 | 2,947 | 3,145 |
| 2016 | 0 | 1,290 | 547 | 0 | 0 | 0 | 0 | 754 | 0 | 0 | ||
| - = No Data Reported; -- = Not Applicable; NA = Not Available; W = Withheld to avoid disclosure of individual company data. |
| Release Date: 12/30/2016 |
| Next Release Date: 01/31/2017 |
Referring Pages: