|
Download Data (XLS File) |
|
||||||||
|
||||||||
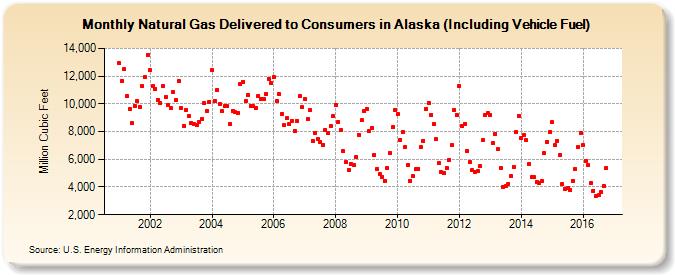
| Natural Gas Delivered to Consumers in Alaska (Including Vehicle Fuel) (Million Cubic Feet) | ||||||||
| Year | Jan | Feb | Mar | Apr | May | Jun | Jul | Aug | Sep | Oct | Nov | Dec |
|---|---|---|---|---|---|---|---|---|---|---|---|---|
| 2001 | 12,927 | 11,677 | 12,492 | 10,557 | 9,618 | 8,588 | 9,860 | 10,185 | 9,784 | 11,290 | 11,926 | 13,523 |
| 2002 | 12,414 | 11,258 | 11,090 | 10,310 | 10,076 | 11,260 | 10,510 | 9,907 | 9,717 | 10,827 | 10,291 | 11,621 |
| 2003 | 9,731 | 8,407 | 9,561 | 9,112 | 8,639 | 8,518 | 8,461 | 8,717 | 8,895 | 10,027 | 9,481 | 10,141 |
| 2004 | 12,414 | 10,221 | 10,996 | 9,967 | 9,462 | 9,831 | 9,829 | 8,537 | 9,512 | 9,377 | 9,374 | 11,436 |
| 2005 | 11,592 | 10,185 | 10,627 | 9,847 | 9,809 | 9,712 | 10,596 | 10,360 | 10,325 | 10,740 | 11,792 | 11,516 |
| 2006 | 11,927 | 10,195 | 10,701 | 9,259 | 8,450 | 8,945 | 8,527 | 8,783 | 8,063 | 8,764 | 10,543 | 9,749 |
| 2007 | 10,328 | 8,873 | 9,552 | 7,332 | 7,930 | 7,460 | 7,241 | 7,054 | 8,115 | 7,885 | 8,389 | 9,093 |
| 2008 | 9,898 | 8,714 | 8,077 | 6,573 | 5,780 | 5,199 | 5,677 | 5,570 | 6,157 | 7,754 | 8,799 | 9,453 |
| 2009 | 9,652 | 8,020 | 8,265 | 6,324 | 5,309 | 4,917 | 4,723 | 4,457 | 5,369 | 6,436 | 8,304 | 9,537 |
| 2010 | 9,261 | 7,395 | 7,943 | 6,889 | 5,620 | 4,436 | 4,766 | 5,278 | 5,311 | 6,881 | 7,354 | 9,659 |
| 2011 | 10,091 | 9,201 | 8,536 | 7,431 | 5,714 | 5,058 | 4,989 | 5,403 | 5,973 | 7,018 | 9,543 | 9,222 |
| 2012 | 11,296 | 8,376 | 8,560 | 6,590 | 5,786 | 5,199 | 5,115 | 5,119 | 5,489 | 7,371 | 9,197 | 9,304 |
| 2013 | 9,180 | 7,144 | 7,858 | 6,714 | 5,395 | 4,020 | 4,068 | 4,217 | 4,773 | 5,478 | 7,944 | 9,136 |
| 2014 | 7,551 | 7,767 | 7,369 | 5,674 | 4,710 | 4,694 | 4,368 | 4,267 | 4,398 | 6,422 | 7,281 | 7,957 |
| 2015 | 8,659 | 7,022 | 7,352 | 6,324 | 4,209 | 3,850 | 3,915 | 3,768 | 4,451 | 5,288 | 6,892 | 7,912 |
| 2016 | 7,029 | 5,882 | 5,551 | 4,286 | 3,739 | 3,319 | 3,399 | 3,639 | 4,082 | 5,385 | ||
| - = No Data Reported; -- = Not Applicable; NA = Not Available; W = Withheld to avoid disclosure of individual company data. |
| Release Date: 12/30/2016 |
| Next Release Date: 01/31/2017 |