‹ Analysis & Projections
Short-Term Energy Outlook
Release Date: December 6, 2016 | Next Release Date: January 10, 2017 | Full Report | Text Only | All Tables | All Figures
U.S. Liquid Fuels
- U.S. crude oil production averaged 9.4 million barrels per day (b/d) in 2015, and it is forecast to average 8.9 million b/d in 2016 and 8.8 million b/d in 2017.
- EIA forecasts Brent crude oil prices to average $43 per barrel (b) in 2016 and $52/b in 2017. West Texas Intermediate (WTI) crude oil prices are forecast to average about $1/b less than Brent prices in 2017. The values of futures and options contracts indicate significant uncertainty in the price outlook. The NYMEX contract values for March 2017 delivery traded during the five-day period ending December 1 suggest that a range from $34/b to $71/b encompasses the market expectation of WTI prices in March 2017 at the 95% confidence level.
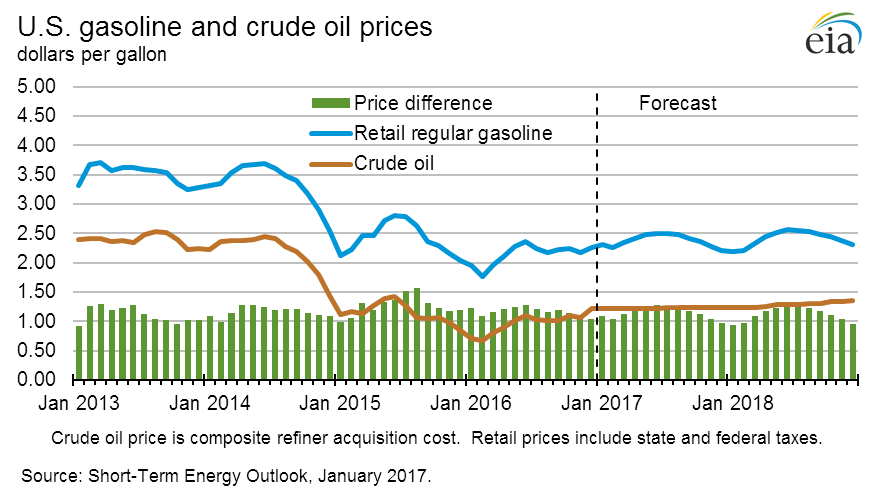
- Lower crude oil prices contributed to U.S. average retail regular gasoline prices in November averaging $2.18 per gallon (gal), a decline of 7 cents/gal from the October level. EIA expects gasoline prices to fall to an average of $2.10/gal in January. Retail gasoline prices are forecast to average $2.14/gal in 2016 and $2.30/gal in 2017.


| U.S. Petroleum and Other Liquids | ||||
|---|---|---|---|---|
| 2014 | 2015 | 2016 projected | 2017 projected | |
| Crude Oil prices | (dollars per barrel) | |||
| WTI Spot Average | 93.17 | 48.67 | 43.07 | 50.66 |
| Brent Spot Average | 98.89 | 52.32 | 43.46 | 51.66 |
| Imported Average | 89.63 | 46.34 | 38.86 | 47.20 |
| Refiner Average Acquisition Cost | 92.05 | 48.40 | 40.92 | 49.70 |
| Retail prices including taxes | (dollars per gallon) | |||
| Regular Gasoline | 3.36 | 2.43 | 2.14 | 2.30 |
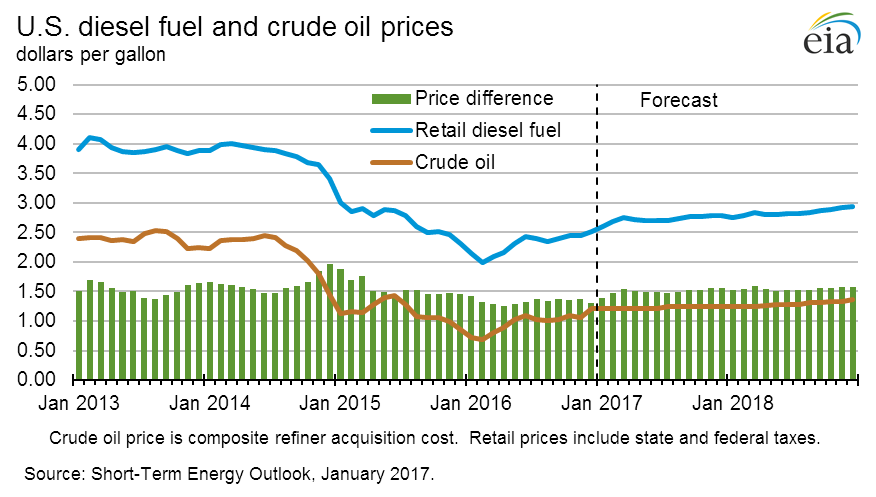
| Diesel Fuel | 3.83 | 2.71 | 2.31 | 2.70 |
| Heating Oil | 3.71 | 2.65 | 2.12 | 2.62 |
| Production | (million barrels per day) | |||
| Crude Oil | 8.76 | 9.42 | 8.86 | 8.78 |
| Natural Gas Plant Liquids | 3.01 | 3.34 | 3.48 | 3.78 |
| Fuel Ethanol | 0.93 | 0.97 | 0.99 | 1.00 |
| Biodiesel | 0.083 | 0.082 | 0.099 | 0.104 |
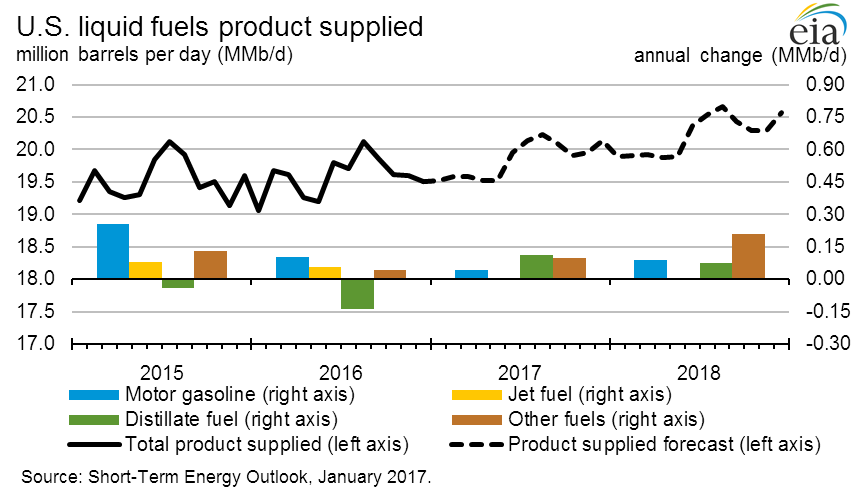
| Consumption | (million barrels per day) | |||
| Motor Gasoline | 8.92 | 9.18 | 9.31 | 9.37 |
| Distillate Fuel Oil | 4.04 | 4.00 | 3.88 | 3.94 |
| Jet Fuel | 1.47 | 1.55 | 1.61 | 1.60 |
| Total Consumption | 19.11 | 19.53 | 19.66 | 19.90 |
| Primary Assumptions | (percent change from previous year) | |||
| U.S. Real GDP Growth | 2.4 | 2.6 | 1.5 | 2.2 |
| Heating Degree Days | 1.9 | -10.2 | -5.6 | 6.5 |
| Distillate-weighted Industrial Production | 0.8 | 1.0 | 0.6 | 1.1 |
Interactive Data Viewers
Provides custom data views of historical and forecast data
STEO Custom Table Builder ›
Real Prices Viewer ›
In beta testing:
STEO Data browser ›
| Related Tables | |||||||
|---|---|---|---|---|---|---|---|
| Table WF01. Average Consumer Prices and Expenditures for Heating Fuels During the Winter | |||||||
| Table 1. U.S. Energy Markets Summary | |||||||
| Table 2. Energy Prices | |||||||
| Table 4a. U.S. Petroleum and Other Liquids Supply, Consumption, and Inventories | |||||||
| Table 4b. U.S. Hydrocarbon Gas Liquids (HGL) and Petroleum Refinery Balances | |||||||
| Table 4c. U.S. Regional Motor Gasoline Prices and Inventories | |||||||
| Table 9a. U.S. Macroeconomic Indicators and CO2 Emissions | |||||||
| Table 9b. U.S. Regional Macroeconomic Data | |||||||
| Table 9c. U.S. Regional Weather Data | |||||||
| Related Articles | ||
|---|---|---|
| Today In Energy | Daily | |
| This Week in Petroleum | Weekly | |
| 2016-2017 Winter Fuels Outlook | Oct-2016 | |
| 2016 Summer Fuels Outlook Slideshow | Apr-2016 | |
| 2015-2016 Winter Fuels Outlook Slideshow | Oct-2015 | |
| 2015 Summer Fuels Outlook Slideshow | Apr-2015 | |
| 2014-2015 Winter Fuels Outlook Slideshow | Oct-2014 | |
| 2014 Outlook for Gulf of Mexico Hurricane-Related Production Outages | Jun-2014 | |
| Energy-weighted industrial production indices | Mar-2014 | |
| Key drivers for EIA's short-term U.S. crude oil production outlook | Feb-2013 | |
| Change in STEO Regional and U.S. Degree Day Calculations | Sep-2012 | |
| Brent Crude Oil Spot Price Forecast | Jul-2012 | |
| 2012 Outlook for Hurricane-Related Production Outages in the Gulf of Mexico | Jun-2012 | |
| STEO Notice: Suspension of Regional Residential Heating Oil and Propane Price Forecast | Jun-2011 | |
| Probabilities of Possible Future Prices | Apr-2010 | |
| Energy Price Volatility and Forecast Uncertainty | Oct-2009 |