‹ Analysis & Projections
Short-Term Energy Outlook
Release Date: December 6, 2016 | Next Release Date: January 10, 2017 | Full Report | Text Only | All Tables | All Figures
Global Liquid Fuels
- U.S. crude oil production averaged 9.4 million barrels per day (b/d) in 2015, and it is forecast to average 8.9 million b/d in 2016 and 8.8 million b/d in 2017.
- EIA forecasts Brent crude oil prices to average $43 per barrel (b) in 2016 and $52/b in 2017. West Texas Intermediate (WTI) crude oil prices are forecast to average about $1/b less than Brent prices in 2017. The values of futures and options contracts indicate significant uncertainty in the price outlook. The NYMEX contract values for March 2017 delivery traded during the five-day period ending December 1 suggest that a range from $34/b to $71/b encompasses the market expectation of WTI prices in March 2017 at the 95% confidence level.
- Lower crude oil prices contributed to U.S. average retail regular gasoline prices in November averaging $2.18 per gallon (gal), a decline of 7 cents/gal from the October level. EIA expects gasoline prices to fall to an average of $2.10/gal in January. Retail gasoline prices are forecast to average $2.14/gal in 2016 and $2.30/gal in 2017.
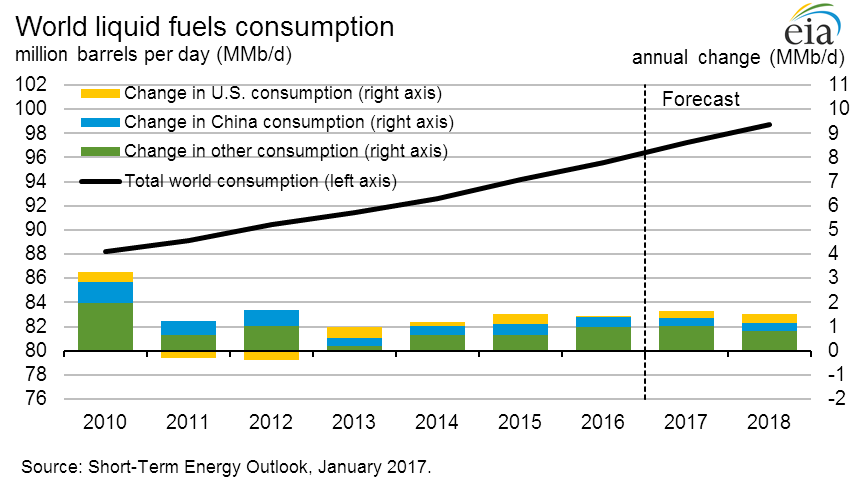
- Global oil inventory builds are forecast to average 0.7 million b/d in 2016 and 0.4 million b/d in 2017.


| Global Petroleum and Other Liquids | ||||
|---|---|---|---|---|
| 2014 | 2015 | 2016 projected | 2017 projected | |
|
a Weighted by oil consumption. b Foreign currency per U.S. dollar. |
||||
| Supply & Consumption | (million barrels per day) | |||
| Non-OPEC Production | 55.88 | 57.48 | 56.85 | 57.20 |
| OPEC Production | 37.45 | 38.31 | 39.29 | 40.22 |
| OPEC Crude Oil Portion | 30.99 | 31.75 | 32.53 | 33.15 |
| Total World Production | 93.34 | 95.78 | 96.14 | 97.42 |
| OECD Commercial Inventory (end-of-year) | 2688 | 2967 | 3057 | 3077 |
| Total OPEC surplus crude oil production capacity | 2.08 | 1.60 | 1.30 | 1.19 |
| OECD Consumption | 45.86 | 46.41 | 46.62 | 46.87 |
| Non-OECD Consumption | 46.72 | 47.66 | 48.81 | 50.13 |
| Total World Consumption | 92.58 | 94.07 | 95.43 | 96.99 |
| Primary Assumptions | (percent change from prior year) | |||
| World Real Gross Domestic Producta | 2.8 | 2.5 | 2.2 | 2.7 |
| Real U.S. Dollar Exchange Rateb | 3.7 | 10.8 | 5.4 | 2.3 |
Interactive Data Viewers
Provides custom data views of historical and forecast data
STEO Custom Table Builder ›
Real Prices Viewer ›
In beta testing:
STEO Data browser ›
| Related Articles | ||
|---|---|---|
| Today In Energy | Daily | |
| 2016 Summer Fuels Outlook Slideshow | Apr-2016 | |
| 2015 Summer Fuels Outlook Slideshow | Apr-2015 | |
| Uncertainties in the Short-Term Global Petroleum and Other Liquids Supply Forecast | Feb-2014 | |
| Key drivers for EIA's short-term U.S. crude oil production outlook | Feb-2013 | |
| Brent Crude Oil Spot Price Forecast | Jul-2012 | |
| Probabilities of Possible Future Prices | Apr-2010 | |
| Energy Price Volatility and Forecast Uncertainty | Oct-2009 |