Climate Change: Ocean Heat Content
The ocean is the largest solar energy collector on Earth. Not only does water cover more than 70 percent of our planet’s surface, it can also absorb large amounts of heat without a large increase in temperature. This tremendous ability to store and release heat over long periods of time gives the ocean a central role in stabilizing Earth’s climate system.
Increasing concentrations of greenhouse gases are preventing heat radiated from Earth’s surface from escaping into space as freely as it used to; most of the excess heat is being stored in the upper ocean. As a result, upper ocean heat content has increased significantly over the past two decades.
Explore this interactive graph: Click and drag to display different parts of the graph. To squeeze or stretch the graph in either direction, hold your Shift key down, then click and drag. This graph (source data) shows differences from the long-term average global ocean heat content (1955-2006) in the top 700 meters of the ocean.
How heat moves
The main source of ocean heat is sunlight. Additionally, clouds, water vapor, and greenhouse gases emit heat that they have absorbed, and some of that heat energy enters the ocean. Waves, tides, and currents constantly mix the ocean, moving heat from warmer to cooler latitudes and to deeper levels.
Heat absorbed by the ocean is moved from one place to another, but it doesn’t disappear. The heat energy eventually re-enters the rest of the Earth system by melting ice shelves, evaporating water, or directly reheating the atmosphere. Thus, heat energy in the ocean can warm the planet for decades after it was absorbed. If the ocean absorbs more heat than it releases, its heat content increases. Knowing how much heat energy the ocean absorbs and releases is essential for understanding and modeling global climate.
Measuring ocean heat
Historically, taking the ocean’s temperature required ships to dangle sensors or sample collectors into the water. This time-consuming method could only provide temperatures for a small part of the planet’s vast ocean. To get global coverage, scientists turned to satellites that measure the height of the ocean’s surface. As water warms, it expands, so estimates for ocean temperature can be deduced from sea surface heights.
To get a more complete picture of ocean heat content at different depths, scientists and engineers also use a range of in situ temperature-sensing instruments. Among these are a fleet of more than 3,000 robotic “floats” that measure ocean temperature around the world. Known as Argo floats, the sensors drift through the ocean at different depths. Every 10 days or so, according to their programmed instructions, they rise through the water, recording temperature (and salinity) as they ascend. When a float reaches the surface, it sends its location and other information to scientists via satellite, and then descends again.
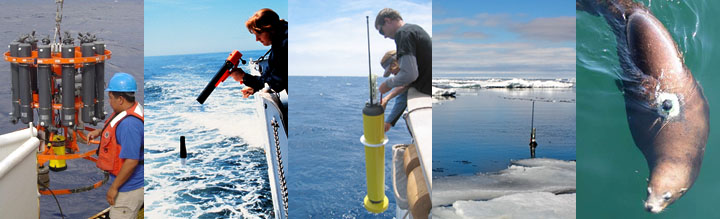
Instruments for taking ocean temperatures include Conductivity-Temperature-Depth instruments (known as CTDs), Expendable Bathythermographs (known as XBTs), and Argo floats. Seals have even been fitted with instruments to obtain temperatures in areas that are difficult to reach. (Photos courtesy of NOAA, Kara Lavender, and M. Weise, California Sea Grant.)
Scientists constantly compare data from satellites, floats, and probes to verify that the values they produce make sense. They process the range of measurements to calculate an estimate for global average ocean heat content every three months. Converting the temperatures to joules (a standard unit of energy) allows them to compare heat in the ocean to heat in other parts of Earth’s climate system.
Change over time
More than 90 percent of the warming that has happened on Earth over the past 50 years has occurred in the ocean. Recent studies estimate that warming of the upper oceans accounts for about 63 percent of the total increase in the amount of stored heat in the climate system from 1971 to 2010, and warming from 700 meters down to the ocean floor adds about another 30 percent. Though the atmosphere has been spared from the full extent of global warming for now, heat already stored in the ocean will eventually be released, committing Earth to additional warming in the future.
In the present, warming of ocean water is raising global sea level because water expands when it warms. Combined with water from melting glaciers on land, the rising sea threatens natural ecosystems and human structures near coastlines around the world. Warming ocean waters are also implicated in the thinning of ice shelves and sea ice, both of which have further consequences for Earth’s climate system. Finally, warming ocean waters threaten marine ecosystems and human livelihoods. For example, warm waters jeopardize the health of corals, and in turn, the communities of marine life that depend upon them for shelter and food. Ultimately, people who depend upon marine fisheries for food and jobs may face negative impacts from the warming ocean.
Further Reading
Information on how ocean heat content is calculated from ocean temperatures is available from NOAA’s National Oceanographic Data Center.
Scott, Michon. 2006. Earth’s Big Heat Bucket. NASA Earth Observatory. Accessed February 2, 2011.
Lindsey, Rebecca. 2008. Correcting Ocean Cooling. NASA Earth Observatory. Accessed February 2, 2011.
References
G. C. Johnson, J. M. Lyman, J. Antonov, N. Bindoff, T. Boyer, C. M. Domingues, S. A. Good, M. Ishii, and J. K. Willis, 2015: [Global Oceans] Ocean Heat Content [in “State of the Climate in 2014”]. Bulletin of the American Meteorological Society (BAMS), 96 (7), S64-S66.
Rhein, M., S. R. Rintoul, S. Aoki, E. Campos, D. Chambers, R. A. Feely, S. Gulev, G. C. Johnson, S. A. Josey, A. Kostianoy, C. Mauritzen, D. Roemmich, L. D. Talley, and F. Wang,2013: Observations: Ocean. In: Climate Change 2013: The Physical Science Basis. Contribution of Working Group I to the Fifth Assessment Report of the Intergovernmental Panel on Climate Change [Stocker, T. F., D. Qin, G.-K. Plattner, M. Tignor, S. K. Allen, J. Boschung, A. Nauels, Y. Xia, V. Bex and P. M. Midgley (eds.)]. Cambridge University Press, Cambridge, United Kingdom and New York, NY, USA, doi:10.1017/CBO9781107415324.010.
S. Levitus, J. I. Antonov, T. P. Boyer, R. A. Locarnini, H. E. Garcia, and A. V. Mishonov. 2009. “Global ocean heat content 1955–2008 in light of recently revealed instrumentation problems” Geophysical Research Letters, 36, L07608, doi:10.1029/2008GL037155.
T. P. Boyer, J. I. Antonov , O. K. Baranova, H. E. Garcia, D. R. Johnson, R. A. Locarnini, A. V. Mishonov, T. D. O’Brien, D. Seidov, I. V. Smolyar, M. M. Zweng, 2009. World Ocean Database 2009. S. Levitus, Ed., NOAA Atlas NESDIS 66, U.S. Gov. Printing Office, Wash., D.C., 216 pp., DVDs.
Data
Global Ocean Heat Content from the National Oceanographic Data Center.
Do you have feedback to offer on this or another article?
Let us know what you think.


You Might Like


![]()