
Data Products and Visualization

Annual Greenhouse Gas Index
The AGGI index provides a point of comparison for tracking annual changes in levels of atmospheric greenhouse gases.
Ozone Depleting Gas Index
The ODGI is an index that relates changes in atmospheric amounts of ozone depleting gases and the recovery of the stratospheric ozone layer.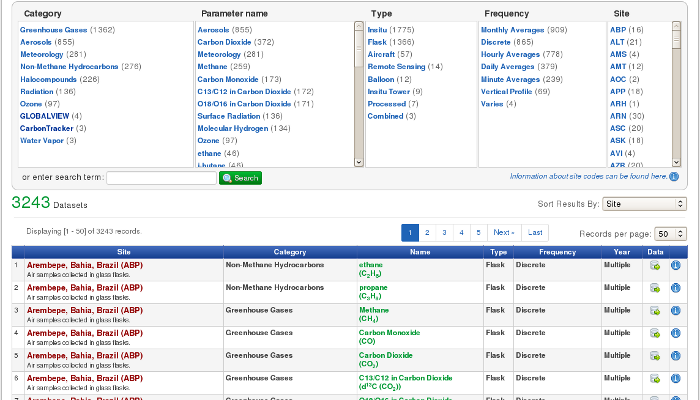
FTP Data Finder
Search for and download datasets available on the GMD public FTP server.
Current Trends in CO2
View graphs and get data for the most recent CO2 atmospheric data at Mauna Loa, Hawaii and for global averages.
Interactive Atmospheric Data Visualization
A data exploration tool for GMD measurements.
Solar Calculator
Generate estimates for sunrise, sunset, solar noon and the position of the sun in the sky for a desired location and date.
CarbonTracker
CarbonTracker is a tool designed to keep track of time dependent emissions and uptake of atmospheric carbon dioxide (CO2), both natural and manmade.
CarbonTracker - CH4
CarbonTracker CH4 is a companion product to CarbonTracker-CO2, producing estimates of emissions of methane to the atmosphere from natural and anthropogenic sources.
Ozone and Water Vapor
View data of the South Pole Ozone hole, plus profiles of ozone from Greenland, and water vapor from Boulder.
Trace Gases
View graphs of N2O, SF6 and halocarbon compounds from the observatory CATS trace gas measurement system.
Radiation
View plots of various types of surface solar and infrared radiation measurements from around the globe.
Aerosols
Up to date plots of measured aerosol properties from the aerosol sampling network.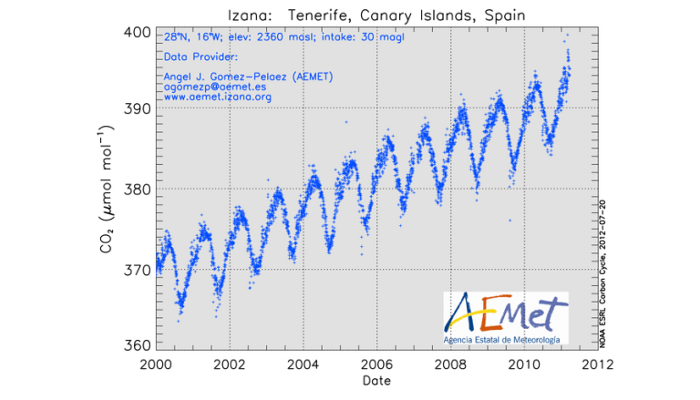
ObsPack
Observation Package (ObsPack) data products are intended to support carbon cycle modeling studies. They include providers' original data and metadata, reformatted into the ObsPack framework.
GLOBALVIEW
The GLOBALVIEW data products enhance the spatial and temporal distribution of atmospheric observations of CO2, CH4 and other related greenhouse gases.
Observation Sites
Information and maps of sites where GMD makes measurements.
Station Meteorology
Most recent weather information from the GMD observatories and a few other locations.