HIV in the United States by Region
In the United States (US) and dependent areas,a HIV diagnosesb are not evenly distributed across states and regions.c

Overall, in the 50 states and the District of Columbia only, most people who receive an HIV diagnosis live in urban areas.
HIV Diagnoses in the 50 States and the District of Columbia by Region, 2018*

Download and Share This Infographicimage icon
*Data excludes persons whose county of residence is unknown.
Source: CDC. HIV surveillance in urban and nonurban areas through 2018pdf icon (slides).
The South’s larger and more geographically dispersed population of people living with HIV creates unique challenges for prevention and treatment.
Understanding the places and populations that are most affected by HIV allows the federal government to allocate its resources to the geographic areas where they are needed most, while still supporting a basic level of HIV education and prevention for everyone across the country.
The Numbers
HIV Diagnoses
Rates of New HIV Diagnoses in the US and Dependent Areas by Region, 2018*

Download and Share This Infographicimage icon
*Rates are per 100,000 people.
Source: CDC. Diagnoses of HIV infection in the United States and dependent areas, 2018. HIV Surveillance Report 2020;31.
From 2014 to 2018, HIV diagnoses decreased 7% overall in the US and dependent areas. But trends varied by region.
HIV Diagnoses in the US and Dependent Areas by Region, 2014-2018

Download and Share This Inforgraphicimage icon
CDC. NCHHSTP AtlasPlus. Accessed May 20, 2020.
Rates of New HIV Diagnoses in the US and Dependent Areas, 2018

Download and Share This Infographicimage icon
Source: CDC. Diagnoses of HIV infection in the United States and dependent areas, 2018. HIV Surveillance Report 2020;31.
New HIV Diagnoses in the US and Dependent Areas by Race/Ethnicity and Region of Residence, 2018

*Black refers to people having origins in any of the black racial groups of Africa. African American is a term often used for Americans of African descent with ancestry in North America.
† Hispanics/Latinos can be of any race.
‡ Subpopulations representing 2% or less of all people who received an HIV diagnosis in 2018 are combined in this chart.
Source: CDC. Diagnoses of HIV infection in the United States and dependent areas, 2018. HIV Surveillance Report 2020;31.
Living With HIV
Adults and Adolescents With HIV in the 50 States and District of Columbia

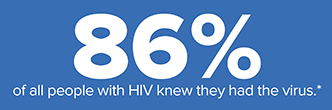

It is important for people to know their HIV status so they can take medicine to treat HIV if they have the virus. Taking HIV medicine every day can make the viral load undetectable. People who get and keep an undetectable viral load (or stay virally suppressed) have effectively no risk of transmitting HIV to HIV-negative sex partners.


Download and Share This Infographicimage icon
*11 out of 17 Southern states fell below this estimate.
† Had 2 viral load or CD4 tests at least 3 months apart in a year.
‡ Based on most recent viral load test.
Source: CDC. Estimated HIV incidence and prevalence in the United States 2014–2018 pdf icon[PDF – 3 MB]. HIV Surveillance Supplemental Report 2019;25(1).
Source: CDC. Selected national HIV prevention and care outcomes ppt icon[PPT – 6 MB] (slides). Accessed May 20, 2020.
Knowledge of HIV status and the health of people with HIV vary widely across the US, with Southern states generally behind other regions in some key HIV prevention and care indicators pdf icon[PDF – 3 MB].
Deaths
In 2018, there were 15,820 deaths among adults and adolescents with diagnosed HIV in the US. Nearly half (47%) of these deaths were in the South; 22% were in the Northeast; 17% were in the West; 12% were in the Midwest; and 2% were in the US dependent areas. These deaths may be due to any cause.
a Unless otherwise noted, the term United States (US) includes the 50 states, the District of Columbia, and the 6 dependent areas of American Samoa, Guam, the Northern Mariana Islands, Puerto Rico, the Republic of Palau, and the US Virgin Islands.
b HIV diagnoses refers to the number of people who received an HIV diagnosis during a given period of time, not when the people got HIV infection.
c Regions used in CDC’s National HIV Surveillance System:
Northeast: CT, ME, MA, NH, NJ, NY, PA, RI, VT
Midwest: IL, IN, IA, KS, MI, MN, MO, NE, ND, OH, SD, WI
South: AL, AR, DE, DC, FL, GA, KY, LA, MD, MS, NC, OK, SC, TN, TX, VA, WV
West: AK, AZ, CA, CO, HI, ID, MT, NV, NM, OR, UT, WA, WY.
- CDC-INFO 1-800-CDC-INFO (232-4636)
- CDC HIV Website
- CDC Let’s Stop HIV Together Campaigns
- CDC HIV Risk Reduction Tool(BETA)
- Find Testing Sites Near You
- CDC. Diagnoses of HIV infection in the United States and dependent areas, 2018. HIV Surveillance Report 2020;31.
- CDC. Estimated HIV incidence and prevalence in the United States 2014–2018 pdf icon[PDF – 3 MB]. HIV Surveillance Supplemental Report 2019;25(1).
- CDC. Selected national HIV prevention and care outcomes ppt icon[PPT – 6 MB] (slides).
- CDC. Monitoring selected national HIV prevention and care objectives by using HIV surveillance data—United States and 6 dependent areas—2018 pdf icon[PDF – 2 MB]. HIV Surveillance Supplemental Report 2020;25(2).
- CDC. NCHHSTP AtlasPlus. Accessed May 20, 2020.
- CDC. HIV surveillance in urban and nonurban areas through 2018 pdf icon[PDF – 2 MB] (slides).