Frequently Asked Questions
General questions
-
What’s the difference between weather and climate?Some people say “weather is what you get” and “climate is what you expect.” “Weather” refers to the more local changes in the climate we see around us, on short timescales from minutes to hours to days to weeks. Examples are familiar – rain, snow, clouds, winds, thunderstorms, heat waves and floods. “Climate” refers to longer-term averages (they may be regional or global), and can be thought of as the weather averaged over several seasons, years or decades. Climate change is harder for us to get a sense of because the timescales involved are much longer, and the impact of climate changes can be less immediate. Examples of climate change include several drier-than-normal summers, a trend of, say, winters becoming milder from our grandparents’ childhood to our own, or variations in effects like El Niño or La Niña.

Credit: Creative Travel Projects/Shutterstock.com READ MORE
-
Is the sun causing global warming?
No. The sun can influence the Earth’s climate, but it isn’t responsible for the warming trend we’ve seen over the past few decades. The sun is a giver of life; it helps keep the planet warm enough for us to survive. We know subtle changes in the Earth’s orbit around the sun are responsible for the comings and goings of the ice ages. But the warming we’ve seen over the last few decades is too rapid to be linked to changes in Earth’s orbit, and too large to be caused by solar activity. In fact, recently (2005-2010) the sun has become less active, while temperatures have marched upwards.
One of the “smoking guns” that tells us the sun is not causing global warming comes from looking at the amount of the sun’s energy that hits the top of the atmosphere. Since 1978, scientists have been tracking this using sensors on satellites and what they tell us is that there has been no upward trend in the amount of the sun’s energy reaching Earth.

Global surface temperature (top, blue) and the sun's energy received at the top of Earth's atmosphere (red, bottom), from 1978 to 2009. The amount of solar energy received at the top of our atmosphere has followed its natural 11-year cycle of small ups and downs, but with no net increase. Over the same period, global temperature has risen markedly. It is therefore extremely unlikely that the sun has been behind the global temperature trend we’ve seen over several decades. Credit: NOAA National Climatic Data Center. A second smoking gun is that if the sun were responsible for global warming, we would expect to see warming throughout all layers of the atmosphere, from the surface all the way up to the upper atmosphere (stratosphere). But what we actually see is warming at the surface and cooling in the stratosphere. This is consistent with the warming being caused by a build-up of heat-trapping gases near the surface of the Earth, and not by the sun getting “hotter.”
READ MORE
-
Is it too late to prevent climate change?Humans have caused major climate changes to happen already, and we have set in motion more changes still. Even if we stopped emitting greenhouse gases today, global warming would continue to happen for at least several more decades if not centuries. That’s because it takes a while for the planet (for example, the oceans) to respond, and because carbon dioxide – the predominant heat-trapping gas – lingers in the atmosphere for hundreds of years. There is a time lag between what we do and when we feel it.

Credit: BrAt82/Shutterstock.com. In the absence of major action to reduce emissions, global temperature is on track to rise by an average of 6 °C (10.8 °F), according to the latest estimates. Some scientists argue a “global disaster” is already unfolding at the poles of the planet; the Arctic, for example, may be ice-free in the summer within just a few years. Yet other experts are concerned about Earth passing one or more “tipping points” – abrupt, perhaps irreversible changes that tip our climate into a new state.
But it may not be too late to avoid or limit some of the worst effects of climate change. Responding to climate change will involve a two-tier approach: 1) “mitigation” – reducing the flow of greenhouse gases into the atmosphere; and 2) “adaptation” – learning to live with, and adapt to, the climate change that has already been set in motion. The key question is: what will our emissions of carbon dioxide and other pollutants be in the years to come? Recycling and driving more fuel-efficient cars are examples of important behavioral change that will help, but they will not be enough. Because climate change is a truly global, complex problem with economic, social, political and moral ramifications, the solution will require both a globally-coordinated response (such as international policies and agreements between countries, a push to cleaner forms of energy) and local efforts on the city- and regional-level (for example, public transport upgrades, energy efficiency improvements, sustainable city planning, etc.). It’s up to us what happens next.
Thwaites Glacier. Credit: NASA. READ MORE
-
Is the ozone hole causing climate change?Yes and no. The ozone hole is basically a man-made hole in the ozone layer above the South Pole during the Southern Hemisphere’s spring. The ozone layer, which lies high up in the atmosphere, shields us from harmful ultraviolet (UV) rays that come from the sun. Unfortunately we punched a hole in it, through the use of gases like chlorofluorocarbons (CFCs) in spray cans and refrigerants, which break down ozone molecules in the upper atmosphere.

False-color view of total ozone over the Antarctic pole. Purple and blue represent areas where there is the least ozone, yellows and reds where there is more ozone. Credit: NASA Ozone Hole Watch. While some of the sun’s UV rays slip through the hole, they account for less than one percent of the sun’s energy. So these UV rays cannot explain the global warming of the planet.
What scientists have uncovered recently, however, is that the ozone hole has been affecting climate in the Southern Hemisphere. That’s because ozone is also a powerful greenhouse gas, and destroying it has made the stratosphere (the second layer of the atmosphere going upwards) over the Southern Hemisphere colder. The colder stratosphere has resulted in faster winds near the pole, which somewhat surprisingly can have impacts all the way to the equator, affecting tropical circulation and rainfall at lower latitudes. The ozone hole is not causing global warming, but it is affecting atmospheric circulation.
READ MORE
-
Do scientists agree on climate change?Yes, the vast majority of actively publishing climate scientists – 97 percent – agree that humans are causing global warming and climate change. Most of the leading science organizations around the world have issued public statements expressing this, including international and U.S. science academies, the United Nations Intergovernmental Panel on Climate Change and a whole host of reputable scientific bodies around the world). The number of peer-reviewed scientific papers that reject the consensus on human-caused global warming is a vanishingly small proportion of the published research. The small amount of dissent tends to come from a few vocal scientists who are not experts in the climate field or do not understand the scientific basis of long-term climate processes.

Credit: nito/Shutterstock.com READ MORE
- Consensus: 97% of climate scientists agree
- “The scientific consensus on climate change,” N. Oreskes, Science, Vol. 306 no. 5702, p. 1686, doi: 10.1126/science.1103618 (2004).
- “Quantifying the consensus on anthropogenic global warming in the scientific literature,” J. Cook et al., Environ. Res. Lett., 8 024024, doi:10.1088/1748-9326/8/2/024024 (2013).
-
What’s NASA got to do with climate change?When people think of NASA, they think of rovers on Mars, astronauts floating aboard the International Space Station, or probes veering out to the edge of the solar system. They don’t necessarily link NASA with climate research and observations. But Earth is a planet too, and NASA is one of the biggest players in the Earth science arena, with broad expertise on observing our climate, especially from the vantage point of space. Today it spends over a billion dollars a year doing Earth science and has more than a dozen satellites in orbit around the planet watching the oceans, land, ice, atmosphere and biosphere.

NASA has more than a dozen Earth science spacecraft/instruments in orbit studying all aspects of the Earth system (oceans, land, atmosphere, biosphere, cryosphere), with several more planned for launch in the next few years. In the 1970s, NASA’s planetary exploration budget fell dramatically. It was then that the agency really got into the business of studying our home planet from orbit. It was also a time when people were beginning to realize that our climate could change relatively fast, on the scale of the human lifespan. Today, we know that our climate is changing at an unprecedented rate and that humans are a key part of that change. NASA continues to launch new satellite missions, and is also relying on aircraft (manned and unmanned), as well as scientists on the ground, to take vital measurements of things like snowpack and hurricanes, augmenting the big-picture view we get from space.
NASA’s role is to make observations of our climate that can be used by the public, policymakers and to support strategic decisions. Its job is to do rigorous science. However, the agency does not promote particular climate policies.
READ MORE
-
What is the greenhouse effect?The greenhouse effect is the way in which heat is trapped close to the surface of the Earth by “greenhouse gases”. These heat-trapping gases can be thought of as a blanket wrapped around the Earth, which keeps it toastier than it would be without them. Greenhouse gases include carbon dioxide, methane and nitrous oxides.
Credit: NASA Jet Propulsion Laboratory. Greenhouse gases arise naturally, and are part of the make-up of our atmosphere. Earth is sometimes called the “Goldilocks” planet – it’s not too hot, not too cold, and the conditions are just right to allow life, including us, to flourish. Part of what makes Earth so amenable is the naturally-arising greenhouse effect, which keeps the planet at a friendly 15 °C (59 °F) on average. But in the last century or so, humans have been interfering with the energy balance of the planet, mainly through the burning of fossil fuels that give off additional carbon dioxide into the air. The level of carbon dioxide in Earth’s atmosphere has been rising consistently for decades and traps extra heat near the surface of the Earth, causing temperatures to rise.
READ MORE
-
How do we know what greenhouse gas and temperature levels were in the distant past?Ice cores are scientists’ best source for historical climate data. Every winter, some snow coating Arctic and Antarctic ice sheets is left behind and compressed into a layer of ice. By extracting cylinders of ice from sheets thousands of meters thick, scientists can analyze dust, ash, pollen and bubbles of atmospheric gas trapped inside. The deepest discovered ice cores are an estimated 800,000 years old. The particles trapped inside give scientists clues about volcanic eruptions, desert extent and forest fires. The presence of certain ions indicates past ocean activity, levels of sea ice and even the intensity of the sun. The bubbles can be released to reveal the make-up of the ancient atmosphere, including greenhouse gas levels.

A thin section of an ice core extracted from under the Greenland Ice Sheet. Credit: NASA Goddard Space Flight Center/Ludovic Brucker. Other tools for learning about Earth’s ancient atmosphere include growth rings in trees, which keep a rough record of each growing season’s temperature, moisture and cloudiness going back about 2,000 years. Corals also form growth rings that provide information about temperature and nutrients in the tropical ocean.
Credit: roundstripe/Shutterstock.com READ MORE
-
Why does the temperature record shown on your "Vital Signs" page begin at 1880?
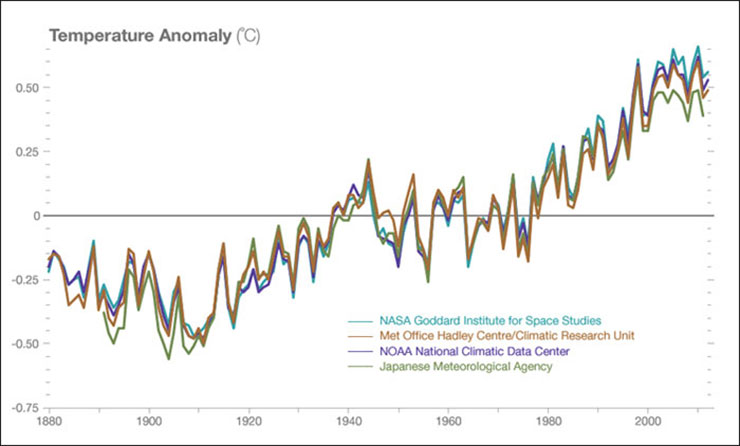
Temperature data from four international science institutions. All show rapid warming in the past few decades. According to NASA data, 2013 tied with 2009 and 2006 for the seventh warmest year since 1880, continuing a long-term trend of rising global temperatures. With the exception of 1998, the 10 warmest years in the 134-year record all have occurred since 2000, with 2010 and 2005 ranking as the warmest years on record. Credit: NASA. Three of the world’s most complete temperature tracking records – from NASA’s Goddard Institute for Space Studies, the National Oceanic and Atmospheric Administration’s National Climactic Data Center and the UK Meteorological Office’s Hadley Centre – begin in 1880. Prior to 1880, temperature measurements were made with instruments like thermometers. The oldest continuous temperature record is the Central England Temperature Data Series, which began in 1659, and the Hadley Centre has some measurements beginning in 1850, but there are too few data before 1880 for scientists to estimate average temperatures for the entire planet. Data from earlier years is reconstructed from proxy records like tree rings, pollen counts and ice cores. Because these are different kinds of data, scientists generally don’t put proxy-based estimates on the same charts as the “instrumental record.”
The above-mentioned agencies and others collect temperature data from thousands of weather stations worldwide, including over the ocean, in Antarctica and from satellites. However, instruments are not perfectly distributed around the globe, and some measurement sites have been deforested or urbanized since 1880, affecting temperatures nearby. Each agency uses algorithms to filter the effects of these changes out of the temperature record and interpolate where data is sparse, like over the vast southern ocean, when calculating global averages. Generally, all three datasets agree quite closely (see graph above) and are in agreement on the trend of global warming since the Industrial Revolution.
READ MORE
-
What do volcanoes have to do with climate change?Overall, volcanoes release about 5 percent of the equivalent amount of CO2 released by humans. Quite small. However, about once every 20 years there is a volcanic eruption (e.g., Mount Pinatubo, El Chichon) that throws out a tremendous amount of particles and other gases. These will effectively shield us enough from the sun to lead to a period of global cooling. The particles and gases typically dissipate after about 2 years, but the effect is nearly global.

Mount Pinatubo during its 1991 eruption
How global temperatures are studied
-
Does data processing destroy the original data?No, the original records are preserved and are available at no cost online. You can access NCDC's U.S. and global records here.

An example of the original weather and climate records archived at NCDC. Station records like this one are available here. For more technical answers on this topic, visit GISS's FAQs and NCDC's FAQs.
Less frequently asked, but interesting
-
If all of Earth's ice melts and flows into the ocean, what would happen to the planet's rotation?

Credit: BlueRingMedia/Shutterstock.com. The Earth rotates about its axis once a day, but it does not do so uniformly. Instead, the rate of rotation varies by up to a millisecond per day. Like a spinning ice skater whose speed of rotation increases as the skater’s arms are brought closer to their body, the speed of the Earth’s rotation will increase if its mass is brought closer to its axis of rotation. Conversely, the speed of the Earth’s rotation will decrease if its mass is moved away from the rotation axis.
Melting land ice, like mountain glaciers and the Greenland and Antarctic ice sheets, will change the Earth’s rotation only if the meltwater flows into the oceans. If the meltwater remains close to its source (by being trapped in a glacier lake, for example), then there is no net movement of mass away from the glacier or ice sheet, and the Earth’s rotation won’t change. But if the meltwater flows into the oceans and is dispersed, then there is a net movement of mass and the Earth’s rotation will change. For example, if the Greenland ice sheet were to completely melt and the meltwater were to completely flow into the oceans, then global sea level would rise by about seven meters (23 feet) and the Earth would rotate more slowly, with the length of the day becoming longer than it is today, by about two milliseconds.
Melting sea ice, such as the Arctic ice cap, does not change sea level because the ice displaces its volume and, hence, does not change the Earth’s rotation.
-
Which is a bigger methane source: cow belching or cow flatulence?

Contrary to common belief, it’s cow belching due to enteric fermentation. (“Enteric fermentation” is the digestive process of converting sugars into simple molecules for absorption into the bloodstream, which produces methane as a by-product.) However, a small percentage of methane is also produced in the cow’s large intestine and then expelled. Settling ponds and lagoons for processing manure also produce copious amounts of this greenhouse gas.


