Click on map to zoom to small-size 60 x 40-degree tiles; use drop-down menu below to view larger-size 60 x 40-degree tiles.
Right-click outside clickable map area to save the image.
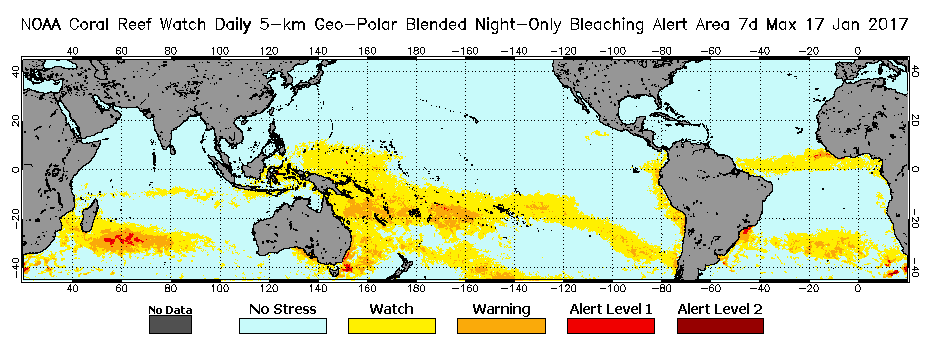
The NOAA Coral Reef Watch (CRW) daily 5-km satellite Bleaching
Alert Area (7-day maximum) product presented here outlines the areas where coral bleaching thermal
stress currently reaches various bleaching stress levels, based on our
satellite sea surface temperature (SST) monitoring.
SST variability is often considerably higher at the much finer 5-km spatial and daily temporal resolutions,
when compared with CRW's 50-km twice-weekly SST. Due to resulting day-to-day fluctuations between stress
levels in highly-variable locations, the single-day 5-km Bleaching Alert Area product does not consistently and
adequately identify potentially harmful thermal stress levels, especially with regard to the impact of accumulated
thermal stress. Rather than requiring users to examine the single-day 5-km Bleaching Alert Area product over several
days, a 7-day maximum Bleaching Alert Area composite product, updated daily, was introduced in the Version 2 5-km product
suite. This 7-day composite product shows the maximum stress level that a pixel has experienced during the most
recent seven (7) consecutive days. The data and images are dated on the last day of the 7-day period.
Additionally, the 5-km Bleaching Alert Area (7-day maximum) composite product is compatible with CRW's
operational 50-km twice-weekly Bleaching Alert Area product. The 50-km Bleaching Alert
Area product is actually based on a half-week (3 or 4 days) composite of 50-km SSTs, but with much less SST variability
due to its much coarser spatial resolution.
The coral bleaching thermal stress levels of the daily 5-km Bleaching Alert Area (7-day maximum) product
are defined in the table below and are based on the current values of CRW's 5-km
Coral Bleaching HotSpot and
Degree Heating Week (DHW)
products.
No Bleaching Possible Bleaching Bleaching Likely Mortality Likely
Please note that locations with a current status of Bleaching Watch or No Stress
recently may have been exposed to thermal stress. Although these two levels
classify the current thermal stress condition, they do not take into account
the recent stress history that is measured by the
5-km DHW product.
When the instantaneous thermal stress during the
current twice-weekly time period drops to a Bleaching Watch or No Stress level
from a previously higher level, this product does not present any information
on accumulated thermal stress during the past 12 weeks up to the previous
twice-weekly period. Hence, a coral reef that is at Alert Level 2 one week may drop
to Bleaching Watch or No Stress the following week. Please refer to CRW's
5-km DHW product for information on the accumulated thermal stress during the
past 12 weeks.
This product is updated each afternoon at about 13:30 U.S. Eastern Time.


![[big]](images_current/cur_b05kmnn_max_r07d_baa_ctr_2790x1740.gif)
![[big]](images_current/cur_b05kmnn_max_r07d_baa_crb_2790x1740.gif)