Petroleum & Other Liquids
This Week in Petroleum
Release date: March 9, 2016 | Next release date: March 16, 2016
EIA lowers its crude oil price forecast
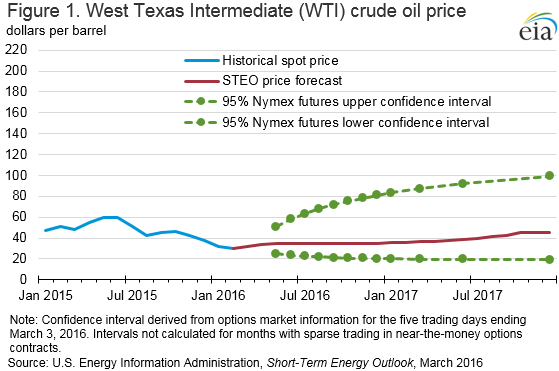
The Short-Term Energy Outlook (STEO) released on March 8 forecasts that North Sea Brent crude oil prices will average $34 per barrel (b) in 2016 and $40/b in 2017, $3/b and $10/b lower, respectively, than expected in last month’s STEO. EIA expects that West Texas Intermediate (WTI) prices will average the same as Brent in 2016 and 2017, based on the assumption that the two crudes will compete in the U.S. Gulf Coast refinery market during the forecast period, with similar transportation differentials from their respective pricing points to that market.
The current value of futures and options prices contracts continue to suggest high uncertainty in the price outlook (Figure 1). For example, WTI futures contracts for June 2016 delivery, traded during the five-day period ending March 3, averaged $37/b, while implied volatility averaged 50%. These levels established the lower and upper limits of the 95% confidence interval for the market's expectations of monthly average WTI prices in June 2016 at $24/b and $58/b, respectively. The 95% confidence interval for market expectations widens over time, with lower and upper limits of $20/b and $81/b for prices in December 2016. At this time last year, WTI for June 2015 delivery averaged $54/b, and implied volatility averaged 46%.
The lowering of the price forecast in the current STEO reflects oil production that has been more resilient than expected in a low-price environment and reduced expectations for oil demand growth. The resulting inventory builds are larger than previously expected throughout the forecast period, thus delaying the expected rebalancing of the oil market and contributing to lower forecast oil prices.
The increased inventory builds are a major source of uncertainty in the price forecast. If global storage capacity becomes stressed, the cost of storage will rise to reflect more expensive marginal storage options such as floating inventories on crude oil tankers. Higher storage costs would tend to divert volumes that would otherwise be stored into the spot market, reducing near-month crude oil prices. Additional uncertainty stems from the pace of global economic growth and its contribution to oil demand growth, and the responsiveness of non-OPEC producers to sustained low oil prices.
The confidence range for crude oil prices as shown in Figure 1 is derived using a variation of the Black-Scholes model that is often used by financial analysts to estimate the price of options. EIA starts with options prices for WTI crude oil, and uses the Black-Scholes model to calculate the implied volatility. WTI futures contracts and options are the among the more actively traded commodity derivative products, involving many producers, consumers (including refiners, airlines, trucking companies, and fuel distributors), and other investors and risk-takers. The confidence interval is therefore a market-derived range that is not directly dependent on EIA's supply and demand estimates.
On the supply side, production is relatively resilient through the forecast period because of non-OPEC investments committed to projects when oil prices were higher. Although oil companies have reduced investments, most of the cuts have been in capital exploration budgets that largely affect production levels beyond the forecast period.
Russia is one example of production exceeding EIA’s expectations. Fourth-quarter 2015 production in Russia is 0.2 million b/d higher than in last month’s STEO, with initial data indicating it has remained at high levels in early 2016. This higher historical production creates a higher base line that carries through the forecast period. Russia’s production is expected to increase by 0.2 million b/d in 2016 and then decline by 0.1 million b/d in 2017. Russia’s exposure to low oil prices has been mitigated by the depreciation of the ruble compared with the dollar, lowering Russian oil companies’ ruble-denominated production costs compared with dollar-denominated revenue, and by Russia’s taxation regime for the oil sector.
Additionally, lower expectations for global economic growth contributed to a reduction in the oil demand forecast. EIA expects global consumption of petroleum and other liquid fuels to grow by 1.1 million b/d in 2016 and by 1.2 million b/d in 2017. Forecast consumption is 0.1 million b/d and 0.2 million b/d lower in 2016 and 2017, respectively, than in last month’s STEO because of lower expected growth in real gross domestic product (GDP) for the world weighted by oil consumption. After rising by 2.4% in 2015, forecast real GDP weighted by oil consumption rises by 2.3% in 2016 and by 3.0% in 2017. In the February STEO, growth was forecast at 2.6% in 2016 and 3.1% in 2017.
U.S. average retail regular gasoline prices and diesel fuel prices increase
The U.S. average retail regular gasoline price increased six cents from the previous week to $1.84 per gallon, but was down 65 cents from the same time last year. The Midwest price increased nine cents to $1.82 per gallon. The Rocky Mountain price rose eight cents to $1.78 per gallon. The East Coast, West Coast, and Gulf Coast prices each increased four cents to $1.78 per gallon, $2.24 per gallon, and $1.60 per gallon, respectively.
The U.S. average diesel fuel price increased three cents from the prior week to $2.02 per gallon, down 92 cents from the same time last year. The Midwest and Rocky Mountain prices both increased five cents to $1.98 per gallon, and $1.93 per gallon. The Gulf Coast and West Coast prices increased three cents to $1.91 per gallon and $2.22 per gallon, respectively. The East Coast prices increased two cents to $2.08 per gallon.
Propane inventories fall
U.S. propane stocks decreased by 0.7 million barrels last week to 62.3 million barrels as of March 4, 2016, 8.6 million barrels (16.0%) higher than a year ago. Midwest and East Coast inventories decreased by 1.2 and 0.3 million barrels, respectively, offsetting increases in the Gulf Coast (up 0.6 million barrels) and Rocky Mountain/West Coast (up 0.6 million barrels). Propylene non-fuel-use inventories represented 4.5% of total propane inventories.
Residential heating oil price increases while propane price decreases
As of March 7, 2016, residential heating oil prices averaged just under $2.10 per gallon, less than 1 cent per gallon higher than last week and $1.11 per gallon lower than last year's price for the same week. The wholesale heating oil price this week averaged $1.24 per gallon, nearly 11 cents per gallon higher than last week and 90 cents per gallon lower than a year ago.
Residential propane prices averaged $2.02 per gallon, less than 1 cent per gallon lower than last week and almost 34 cents per gallon lower than one year ago. Wholesale propane prices averaged just under 53 cents per gallon, nearly 2 cents per gallon higher than last week and almost 24 cents per gallon lower than the price last year.
For questions about This Week in Petroleum, contact the Petroleum Markets Team at 202-586-4522.
Retail prices (dollars per gallon)

| Retail prices | Change from last | ||
|---|---|---|---|
| 03/07/16 | Week | Year | |
| Gasoline | 1.841 | 0.058 | -0.646 |
| Diesel | 2.021 | 0.032 | -0.923 |
| Heating Oil | 2.095 | 0.006 | -1.112 |
| Propane | 2.021 | -0.005 | -0.338 |
Futures prices (dollars per gallon*)
| Futures prices | Change from last | ||
|---|---|---|---|
| 03/04/16 | Week | Year | |
| Crude oil | 35.92 | 3.14 | -13.69 |
| Gasoline | 1.332 | 0.315 | -0.550 |
| Heating oil | 1.161 | 0.110 | -0.708 |
| *Note: Crude oil price in dollars per barrel. | |||
Stocks (million barrels)


| Stocks | Change from last | ||
|---|---|---|---|
| 03/04/16 | Week | Year | |
| Crude oil | 521.9 | 3.9 | 73.0 |
| Gasoline | 250.5 | -4.5 | 10.6 |
| Distillate | 162.5 | -1.1 | 37.0 |
| Propane | 62.320 | -0.745 | 8.576 |