Search Results
Impacts of Rising CO2 on the Nutritional Value of Crops
... carbohydrates-to-protein ratio can have unhealthy effects on human metabolism and body mass. ...
Figure 6.7: Projections of Growth of Alexandrium in Puget Sound

... rate values above 0.25_d constitute a bloom of Alexandrium (Figure source: adapted from Jacobs et al. 2015) ...
A2.1 Introduction
... of information submitted by the public, screening and assessment of the eligibility of the collected literature, and synthesis of the ...
Photo

Farmer in drought-stressed peanut field in Georgia. Health implications of drought include contamination and depletion of water ...
Key Finding 3: Changing Tolerance to Extreme Heat
An increase in population tolerance to extreme heat has been observed over time [Very High Confidence]. Changes in ...
Figure 9.4: Mapping Social Vulnerability
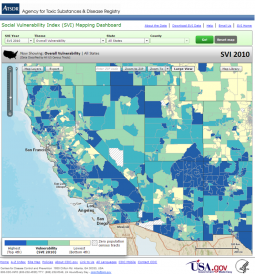
... (the top quartile) with the lowest quartile in pale yellow. (Figure source: ATSDR 2015) ...
Figure ES6: Changes in Lyme Disease Case Report Distribution

... of cases have increased (see Ch. 5: Vector-Borne Diseases). (Figure source: adapted from CDC 2015) ...
Figure 3.4: Ragweed Pollen Season Lengthens
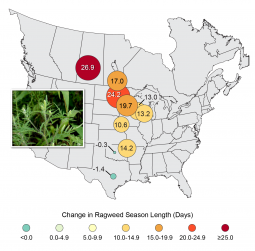
... largest increases have been observed in northern cities. (Figure source: Melillo et al. 2014. Photo credit: Lewis Ziska, USDA). ...
Figure 5.4: Projected Change in Lyme Disease Onset Week

... Additional details can be found in Monaghan et al. (2015). (Figure source: adapted from Monaghan et al. 2015). ...
Key Finding 4: Some Populations at Greater Risk
... children have a higher risk of dying or becoming ill due to extreme heat [Very High Confidence]. People working outdoors, the socially ...
Figure 7.5: Mississippi River Level at St. Louis, Missouri

... 2012 drought and water levels above flood stage in 2013. (Figure source: adapted from USGS 2015) ...
Figure 6.4: Projections of Vibrio Occurrence and Abundance in Chesapeake Bay
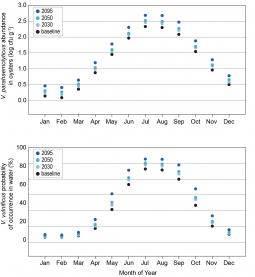
... (2025–2034), 2050 (2045–2054), and 2095 (2090–2099). (Figure source: adapted from Jacobs et al. 2015). ...

Figure 6.5: Changes in Suitable Coastal Vibrio Habitat in Alaska
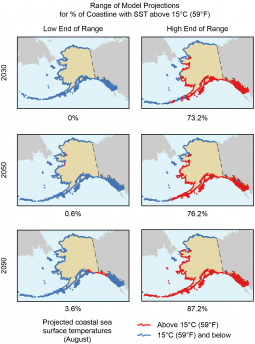
... shoreline in August will become suitable Vibrio habitat. (Figure source: adapted from Jacobs et al. 2015) ...
Photo

... by additional emissions reductions of ozone precursors, climate-drivenincreases in ozone will cause premature deaths, hospital visits, ...
Key Finding 3: Worsened Allergy and Asthma Conditions
Changes in climate, specifically rising temperatures, altered precipitation patterns, and ...
Figure 6.6: Projected Changes in Caribbean Gambierdiscus Species
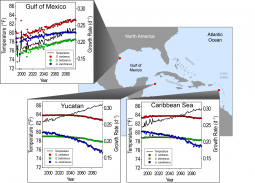
... G. belizeanus, G. carolinianus) for the period 2014–2099. (Figure source: adapted from Kibler et al. 2015). ...
Figure 5.2: Changes in Lyme Disease Case Report Distribution

... the distribution and the numbers of cases have increased. (Figure source: adapted from CDC 2015) ...
Figure 1.1: Major U.S. Climate Trends

Major U.S. national and regional climate trends. Shaded areas are the U.S. regions defined in the 2014 NCA. ...
Photo

Many medications used to treat a variety of mental health disorders interfere with temperature regulation and heat elimination and ...
Figure 7.3: Seasonality of Human Illnesses Associated With Foodborne Pathogens

... (dashed lines) are plus and minus one standard deviation. (Figure sources: a, b, and c: adapted from Lal et al. 2012; d: adapted from ...
Key Finding 4: Mapping Tools and Vulnerability Indices Identify Climate Health Risks
The use of geographic data and tools allows for more sophisticated mapping of risk factors and social vulnerabilities to identify and protect specific locations and groups of people [High Confidence].

Figure 1.3: Projected Changes in Temperature and Precipitation by Mid-Century
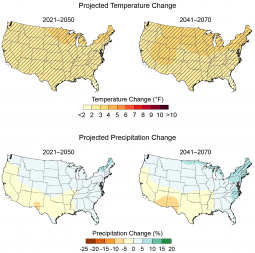
... portions of the Northeast, as indicated by the hatching. (Figure source: adapted from Sun et al. 2015) ...
Photo

Extreme precipitation events have been statistically linked to increased levels of pathogens in ...
- 1 of 9
- ››