| Q |
Where does the Interactive Map get its data? |
| A |
The information on the map comes from many sources. Natural Resources Conservation Service snowpack and precipitation data are derived from manually-collected snow courses and automated Snow Telemetry (SNOTEL) and Soil Climate Analysis Network (SCAN) stations. Other data sources include precipitation, streamflow, and reservoir data from the U.S. Bureau of Reclamation (BoR), the Applied Climate Information System (ACIS), the U.S. Geological Survey (USGS), and other hydrometeorological monitoring entities. |
| |
|
| Q |
How often is information updated on the Interactive Map? |
| A |
Information supplied by the map is updated three times daily. |
| |
|
| Q |
Is there a definition for each of the elements and parameters used in the interactive map? |
| A |
Click here for a glossary of terms. |
| |
|
| Q |
Can I display labels for points on the Interactive Map? |
| A |
Yes, it's simple to show site names, IDs, and other labels. For ease of viewing, it's best to first zoom in to your area of interest on the map. Then, at the bottom of the map controls, click the right arrow (u) on the Labels list to expand it. Click the checkbox next to any or all of the labels you wish to display.

|
| |
|
| Q |
Is there a way to show what stations comprise the Selected Stations list on the map? |
| A |
Click the right arrow (u) on the Selected Stations label (at the top left portion of the map) to expand the list. All the stations meeting the selection criteria will be displayed alphabetically. Select a station in the list to jump to that station on the map and display metadata, site information, and access to reports. Select the View Metadata Report link at the top of the list to create a full report with metadata for all the stations in the Selected Stations list. |
| |
|
| Q |
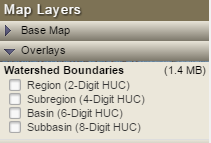
Can I show watershed boundaries on the map? |
| A |
At the bottom of the map controls, click the right arrow (u) on the Overlays list to expand it. Click the checkbox next to any or all of the hydrological unit code (HUC) boundaries you wish to display.
|
| |
|
| Q |
I've created a map that I want to save for future use. Is there a way to save these settings? |
| A |
Yes. Simply save or bookmark (¶) the url into the Favorites folder of your browser. |
| |
|
| Q |
I'd like to change the color scheme on the map and legend. Is that possible? |
| A |
In Conditions view, click the Change Color Set link in the legend to toggle through several color sets for the map display.

|
| |
|
| |
|