Petroleum & Other Liquids
This Week in Petroleum
Release date: August 17, 2016 | Next release date: August 24, 2016
OPEC net oil export revenue in 2015 drops to lowest level since 2004
Members of the Organization of the Petroleum Exporting Countries (OPEC) earned $404 billion in net oil export revenue in 2015, according to recently published U.S. Energy Information Administration (EIA) estimates (Figure 1). This represents a 46% decline from the estimated $753 billion earned in 2014 and a 56% drop from the estimated $921 billion revenue received in 2012. While these net export earnings include Iran's revenues, they are not adjusted for possible price discounts that Iran may have offered its customers between late 2011 and January 2016, when nuclear-related sanctions targeting Iran's oil sales were in place.

EIA's estimated net oil export revenue is based on its oil production and consumption estimates, as well as its forecast for oil prices from the Short-Term Energy Outlook (STEO) published in June 2016. EIA assumes that exports are sold at prevailing spot prices, and adjusts the benchmark crude oil prices that are forecasted in the STEO (Brent, West Texas Intermediate, and the average imported refiner crude oil acquisition cost) to incorporate historical price differentials between spot prices for the different OPEC crude oil types. For countries that export several different varieties of crude oil, EIA assumes that the proportion of total net oil exports represented by each variety is equal to the proportion of the total domestic production represented by that variety. For example, if Arab Medium represents 20% of total oil production in Saudi Arabia, the estimate assumes that Arab Medium also represents 20% of total net oil exports from Saudi Arabia.
OPEC revenue has fallen in step with the steep decline in crude oil prices. The monthly average Brent spot price dropped from $112 per barrel (b) in June 2014 to $38/b in December 2015. Based on EIA price forecasts, which are subject to a wide range of uncertainty, OPEC revenue is expected to fall further in 2016 to $341 billion before rising to $427 billion in 2017.
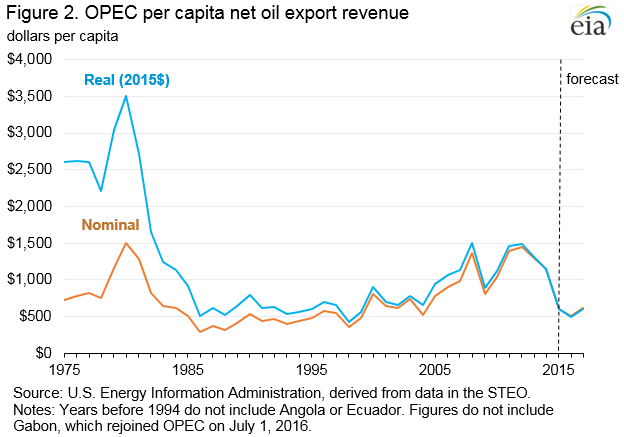
OPEC members' 2015 net export revenue was the lowest since 2004, with significant implications for the fiscal condition of member countries that rely heavily on oil sales to fund social programs and import other goods and services. In inflation-adjusted terms, OPEC per capita net oil export revenue totaled $606 in 2015, down 83% from the 1980 level of $3,500 (Figure 2).
The effects of recent declines in net oil export revenue vary across OPEC member states, depending on the degree of other export streams and existence of other financial assets. Overall, OPEC members are heavily dependent on petroleum exports for revenue, with petroleum exports accounting for 5% (Indonesia) to 99% (Iraq) of total export revenues in 2015, according to OPEC data. Broadly, countries with sizeable financial assets, such as the Gulf States (Saudi Arabia, Kuwait, Qatar, and the United Arab Emirates), are affected to a lesser degree than other oil producing countries such as Iraq, Nigeria, and Venezuela that do not have significant financial reserves. Government deficits, high reliance on oil revenue, and asset coverage of government spending are indicators of geopolitical stress exposure. Therefore, countries such as Venezuela, Nigeria, and Iraq, with fewer financial assets, are more exposed to geopolitical stress than countries with greater financial assets (Figure 3).

While declining crude oil prices have been the main driver behind lower OPEC revenues since mid-2014, unplanned production outages among some OPEC members have also contributed to lower earnings. A number of OPEC countries have experienced relatively high levels of unplanned outages (Table 1). Some of these are because of political factors, such as the sanctions-related production shut-ins in Iran between 2011 and early 2016, when roughly 0.8 million barrels per day (b/d) remained off the market. Since January 2016, when the Joint Comprehensive Plan of Action (JCPOA) was implemented, Iran has been able to increase its crude oil production to presanctions levels of about 3.6 million b/d, with unplanned disruptions effectively disappearing at that time.
| 2015 Average | July 2016 Estimate | |
| Libya | 1,030 |
990 |
| Nigeria | 270 |
715 |
| Iran | 800 |
0 |
| Iraq | 175 |
100 |
OPEC total |
2,700 |
2,300 |
| Table 1. Estimated unplanned crude oil production disruptions, selected OPEC members (thousand barrels per day) | ||
| Source: U.S. Energy Information Administration, Short-Term Energy Outlook, August 2016. | ||
Other unplanned outages are related to armed conflict and militant activity. Libya, for example, has struggled to maintain crude oil production and exports since the fall of the Qaddafi regime in 2011. Political infighting and outright armed conflict among opposing factions since then led to an average shut-in volume of more than 1.0 million b/d of crude oil in 2015, with crude oil production averaging only about 0.4 million b/d during the year. Most recently, opposing factions have been clashing for control over the country's oil export terminals, and lack of available oil export outlets has necessitated that most of Libya's production capacity remain shut in. EIA estimates that Libya's effective production capacity currently stands at 1.3 million b/d with roughly 1.0 million b/d shut in. Libya's crude oil production was 0.3 million b/d in July 2016.
During 2015, Nigeria experienced a relatively low level of crude oil disruptions, which averaged roughly 0.3 million b/d. However, since the beginning of 2016, militant groups have stepped up their attacks in the Niger Delta region, an oil-rich area bordering the Gulf of Guinea that is the mainstay of the country's crude production. So far this year, there have been numerous attacks on oil and natural gas infrastructure throughout the region, largely in response the reduction in amnesty payments and the termination of security contracts to former militants. EIA estimates that Nigeria's production shut-ins were 0.7 million b/d in July, with production averaging less than 1.5 million b/d. EIA estimates that Nigeria's effective production capacity stands at roughly 2.2 million b/d.
In addition to price, unplanned production outages are another source of uncertainty for EIA's OPEC net export revenue estimate. For example, in Venezuela, crude oil production has declined sharply since the end of 2015, as oil service companies have largely stopped work in response to a lack of payment by state-owned Petroleos de Venezuela (PdVSA). As a result, Venezuela's crude oil production declined from an estimated 2.4 million b/d in December 2015 to 2.1 million b/d in July 2016. EIA's crude oil production forecast for Venezuela includes further declines through the end of 2017, but Venezuela's production forecast faces considerable downside risk as PdVSA's financial situation may result in accelerated production declines.
WPSR crude oil production re-benchmarking notice
The weekly estimates of domestic crude oil production are reviewed monthly to identify disconnects with recent trends in domestic production reported in the Petroleum Supply Monthly (PSM) and other current data. If a disconnect between the two series is observed, the weekly production estimate may be re-benchmarked on a monthly basis to address it. This week's domestic crude oil production estimate incorporates a re-benchmarking. Any subsequent re-benchmarking of the weekly production estimate will be implemented on weeks when EIA's Short-Term Energy Outlook (STEO) is released.
U.S. gasoline and diesel fuel prices decline
The U.S. average regular gasoline retail price was $2.15 per gallon on August 15, virtually unchanged from the previous week but down 57 cents from the same time last year. The Midwest, East Coast, and Gulf Coast prices each increased one cent to $2.12 per gallon, $2.08 per gallon, and $1.94 per gallon, respectively. These increases were offset by a four cent price drop in the West Coast to $2.53 per gallon and a more modest decline in the Rocky Mountains, down one cent to $2.21 per gallon.
The U.S. average diesel fuel price fell by one cent to $2.31 per gallon, down 31 cents from the same time last year. The West Coast, East Coast, and Gulf Coast prices each fell one cent to $2.58 per gallon, $2.31 per gallon, and $2.18 per gallon, respectively. The Rocky Mountain and Midwest prices remained virtually unchanged at $2.39 per gallon and $2.27 per gallon, respectively.
Propane inventories gain
U.S. propane stocks increased by 1.8 million barrels last week to 93.7 million barrels as of August 12, 2016, 0.1 million barrels (0.1%) lower than a year ago. East Coast and Gulf Coast inventories increased by 0.9 million barrels and 0.7 million barrels, respectively, while Midwest and Rocky Mountain/West Coast inventories each increased by 0.1 million barrels. Propylene non-fuel-use inventories represented 2.4% of total propane inventories.
For questions about This Week in Petroleum, contact the Petroleum Markets Team at 202-586-4522.
Retail prices (dollars per gallon)


| Retail prices | Change from last | ||
|---|---|---|---|
| 08/15/16 | Week | Year | |
| Gasoline | 2.149 | -0.001 | -0.567 |
| Diesel | 2.310 | -0.006 | -0.305 |
Futures prices (dollars per gallon*)


| Futures prices | Change from last | ||
|---|---|---|---|
| 08/12/16 | Week | Year | |
| Crude oil | 44.49 | 2.69 | 1.99 |
| Gasoline | 1.371 | -0.005 | -0.316 |
| Heating oil | 1.409 | 0.092 | -0.149 |
| *Note: Crude oil price in dollars per barrel. | |||
Stocks (million barrels)


| Stocks | Change from last | ||
|---|---|---|---|
| 08/12/16 | Week | Year | |
| Crude oil | 521.1 | -2.5 | 64.9 |
| Gasoline | 232.7 | -2.7 | 19.9 |
| Distillate | 153.1 | 1.9 | 4.7 |
| Propane | 93.744 | 1.841 | -0.122 |