Petroleum & Other Liquids
This Week in Petroleum
Release date: April 27, 2016 | Next release date: May 4, 2016
Crude oil prices rise and contango narrows, but high inventories should constrain further price increases
Global crude oil prices in April rose in response to near-term supply concerns and a more positive economic outlook that suggests rising demand for crude oil.
The stronger crude oil demand outlook is likely the main reason for higher crude prices across the entire futures curve, whereas the near-term supply concerns are putting additional upward pressure on prices for near-term delivery. As a result, the futures curve for crude oil has both shifted since the beginning of the month and flattened out. The flatter futures curve means that the market's contango (when prices for near-term deliveries are lower than prices for longer-dated deliveries) has narrowed significantly for both North Sea Brent and West Texas Intermediate (WTI), reducing the incentive to store crude oil (Figure 1).
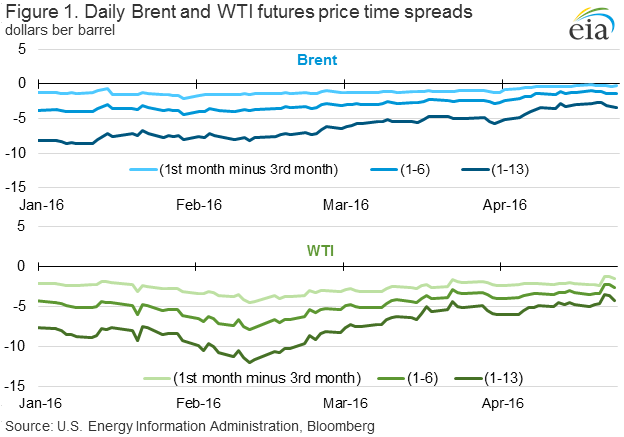
The price difference between Brent crude for delivery one year forward and front month (1-13 spread) narrowed from $5.07 per barrel (b) to $3.23/b between April 1 to April 22 (-36%). At the same time, the 1-13 spread for WTI crude dropped from $6/b to $3.57/b (-41%). The near-term 1-3 spread shows an even larger percentage decline between the the two dates, with the Brent 1-3 spread narrowing from $0.86/b to $0.35/b (-59%) between April 1 to April 22, while the WTI 1-3 spread narrowed from $2.38/b to $1.28/b (-46%) during the same period. The relative tightness in Brent compared to WTI likely reflects the anticipation of a heavier-than-normal summer maintenance season for North Sea production facilities.
Since April 1, front-month futures prices for Brent and WTI crudes increased by more than $6.00/b (Figure 2). One of the major factors putting upward pressure on spot and prompt crude oil prices through mid-April was the possibility of a collaborative production cut or freeze of production rates among members of the Organization of the Petroleum Exporting Countries (OPEC) and other major producers.
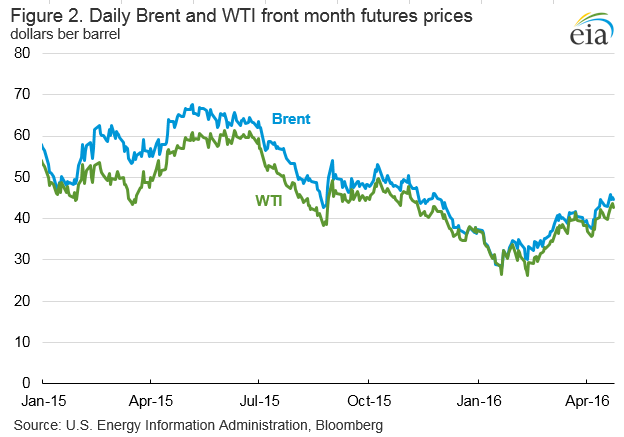
EIA's April Short-Term Energy Outlook (STEO) assumed no collaborative production cut or freeze over the forecast period, and that major OPEC and non-OPEC producers would continue their strategy of maintaining market share. After the recent meeting in Doha ended without an agreement on production levels, some expected that crude oil prices would decrease. Instead, prices continued to increase, and are up $2/b in the days since the meeting ended.
Recent supply disruptions are likely to be affecting oil markets. An oil workers' strike in Kuwait immediately followed the Doha meeting, potentially disrupting Kuwait's 2.6 million barrels per day (b/d) of crude production. Although the strike has been resolved with little to no remaining supply disruption, other disruptions are still influencing oil markets. In March, OPEC's unplanned crude oil supply disruptions averaged 2.3 million b/d, with production outages increasing in places like Nigeria, Libya, and Iraq. Non-OPEC supply was also lower because of outages in Brazil and Ghana.
These disruptions come at a time when non-OPEC production is decreasing and OPEC surplus crude oil production capacity has narrowed. Surplus capacity is an indicator of tight or loose market conditions and surplus capacity below 2.5 million b/d typically indicates relative tightness. However, the high current and forecast levels of global crude oil inventories make the projected low surplus capacity level less significant. EIA currently expects OPEC surplus capacity to average 1.8 million b/d in 2016.
EIA estimates that OECD commercial crude oil and liquid fuels inventories totaled 3.05 billion barrels at the end of 2015, the equivalent to roughly 66 days of consumption (Figure 3). In the United States alone, combined commercial crude oil, distillate, and total motor gasoline inventories were 940 million barrels for the week ending April 22, 92 million barrels more than the year-ago level.

The structure of the crude oil futures market provides insight on whether inventories are building (with a contango structure) or drawing (with a backwardated structure). It also gives indications of the demand for and availability of storage capacity, with a steep contango indicating both high demand for and limited availably of storage.
The recent narrowing contango in crude oil futures prices is the result of current supply disruptions and the risk of future disruptions, as well as rising prices across global markets with the expectation of a narrower future balance between supply and demand. However, the large buildout of global inventories should buffer any differences in supply and demand, potentially constraining near-term crude oil price increases.
U.S. average regular gasoline retail and diesel fuel prices rise
The U.S. average regular gasoline retail price rose three cents from the previous week to $2.16 per gallon on April 25, down 41 cents from the same time last year. The Rocky Mountain and Midwest prices each increased four cents to $2.12 per gallon and $2.10 per gallon, respectively. The East Coast price rose three cents to $2.13 per gallon, while the West Coast price increased one cent to $2.60 per gallon. The Gulf Coast price increased less than a penny, remaining at $1.91 per gallon.
The U.S. average diesel fuel price rose three cents from the previous week to $2.20 per gallon, down 61 cents from the same time last year. The West Coast and Midwest prices each increased four cents to $2.41 per gallon and $2.16 per gallon, respectively. The Rocky Mountain and Gulf Coast prices both increased three cents, to $2.20 per gallon and $2.07 per gallon, respectively. The East Coast price rose two cents to $2.24 per gallon.
Propane inventories gain
U.S. propane stocks increased by 2.3 million barrels last week to 71.2 million barrels as of April 22, 2016, 6.5 million barrels (10.1%) higher than a year ago. Gulf Coast inventories increased by 1.4 million barrels, while Midwest and East Coast inventories increased by 0.9 million barrels and 0.1 million barrels, respectively. Rocky Mountain/West Coast inventories decreased by 0.1 million barrels. Propylene non-fuel-use inventories represented 5.3% of total propane inventories.
For questions about This Week in Petroleum, contact the Petroleum Markets Team at 202-586-4522.
Retail prices (dollars per gallon)


| Retail prices | Change from last | ||
|---|---|---|---|
| 04/25/16 | Week | Year | |
| Gasoline | 2.162 | 0.025 | -0.408 |
| Diesel | 2.198 | 0.033 | -0.613 |
Futures prices (dollars per gallon*)

| Futures prices | Change from last | ||
|---|---|---|---|
| 04/22/16 | Week | Year | |
| Crude oil | 43.73 | 3.37 | -13.42 |
| Gasoline | 1.531 | 0.070 | -0.477 |
| Heating oil | 1.309 | 0.077 | -0.619 |
| *Note: Crude oil price in dollars per barrel. | |||
Stocks (million barrels)


| Stocks | Change from last | ||
|---|---|---|---|
| 04/22/16 | Week | Year | |
| Crude oil | 540.6 | 2.0 | 49.7 |
| Gasoline | 241.3 | 1.6 | 13.8 |
| Distillate | 158.2 | -1.7 | 29.0 |
| Propane | 71.199 | 2.259 | 6.532 |