Search Results
Photo

... Extreme precipitation events have been statistically linked to increased levels of pathogens in treated drinking water supplies. ...
Photo

Dampness and mold in U.S. homes are linked to approximately 4.6 million cases of worsened asthma. ...

Photo

In the eastern United States, Lyme disease is transmitted to humans primarily by blacklegged (deer) ticks. ...
Photo

Farmer in drought-stressed peanut field in Georgia. Health implications of drought include contamination and depletion of water ...
Figure 6.4: Projections of Vibrio Occurrence and Abundance in Chesapeake Bay
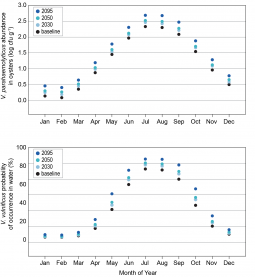
... (2025–2034), 2050 (2045–2054), and 2095 (2090–2099). (Figure source: adapted from Jacobs et al. 2015). ...
Photo

Family affected by Hurricane Sandy prepares to take shelter at the Mennen Sports Arena in Morristown, New Jersey, October ...
Figure 6.5: Changes in Suitable Coastal Vibrio Habitat in Alaska

... shoreline in August will become suitable Vibrio habitat. (Figure source: adapted from Jacobs et al. 2015) ...
Photo

An elderly couple walk to the Superdome days after Hurricane Katrina made landfall. New Orleans, ...
Photo

Freezing rain, snow, and ice have been linked to increased injuries associated with treacherous road conditions and impaired ...
Figure 5.2: Changes in Lyme Disease Case Report Distribution

... the distribution and the numbers of cases have increased. (Figure source: adapted from CDC 2015) ...
Figure 1.1: Major U.S. Climate Trends

Major U.S. national and regional climate trends. Shaded areas are the U.S. regions defined in the 2014 NCA. ...

Photo

... University School ofNursing in Atlanta, Georgia volunteering to give checkups inmigrant workers’ camps, June 12, 2006. ...
Key Finding 3: Changing Tolerance to Extreme Heat
An increase in population tolerance to extreme heat has been observed over time [Very High Confidence]. Changes in ...

Figure 6.7: Projections of Growth of Alexandrium in Puget Sound

... rate values above 0.25_d constitute a bloom of Alexandrium (Figure source: adapted from Jacobs et al. 2015) ...
A2.1 Introduction
... of information submitted by the public, screening and assessment of the eligibility of the collected literature, and synthesis of the ...
Photo

... risk for distress, anxiety, and other adverse mental health effects in the aftermath of an extreme event. ...
Figure 9.4: Mapping Social Vulnerability

... (the top quartile) with the lowest quartile in pale yellow. (Figure source: ATSDR 2015) ...
Figure ES6: Changes in Lyme Disease Case Report Distribution

... of cases have increased (see Ch. 5: Vector-Borne Diseases). (Figure source: adapted from CDC 2015) ...
Key Finding 3: Rising Carbon Dioxide Lowers Nutritional Value of Food
... as rising levels of atmospheric carbon dioxide continue to reduce the concentrations of protein and essential minerals in most plant ...
Photo

... by additional emissions reductions of ozone precursors, climate-drivenincreases in ozone will cause premature deaths, hospital visits, ...
Figure 7.5: Mississippi River Level at St. Louis, Missouri

... 2012 drought and water levels above flood stage in 2013. (Figure source: adapted from USGS 2015) ...
Figure 5.4: Projected Change in Lyme Disease Onset Week

... Additional details can be found in Monaghan et al. (2015). (Figure source: adapted from Monaghan et al. 2015). ...
- 1 of 9
- ››