Water Quality

Beautiful Pawtuckaway faced with milfoil challenges

By Amy Miller

It was an exquisite day at Pawtuckaway State Park. I was circling Horse Island by kayak with my son, my third time paddling since waking that morning on the shores of Pawtuckaway Lake. Earlier I had come across a single loon, happily swimming past my oar. Now, as the woven gold sunset intensified behind the hills of southeastern New Hampshire, we came across a family of five loons all drifting calmly toward their nighttime concert. We also, less pleasingly, came across signs warning us of “Exotic Milfoil Spread.”Pawtuckaway Lake 2

Back on land, I checked out what was going on with this invasive plant that chokes natural vegetation in ponds and lakes across New England. Turns out Pawtuckaway had been free of this harmful intruder until last year. At that point, a small clump of milfoil was seen between the campsites of Horse Island and the houses across the inlet.

Pawtuckaway State Park is a jewel tucked into the countryside just a short drive from many large population centers. On any sunny weekend in summer, Pawtuckaway’s small beach is packed to capacity with people barbecuing, swimming, boating or just plain hanging out with their families. The much quieter campground down the road is likely to have every one of its 195 sites filled and its dirt roads bustling with youthful bikers spinning their wheels until it’s time for s’mores.

NH DES Kayak covered with milfoilPawtuckaway Lake is a 784-acre body of water in the Lamprey River Watershed. For years it has battled periodic bacteria overload from geese, development and general runoff. But until last year’s infestation, milfoil has not been a problem.

Unfortunately, efforts to get rid of the milfoil last year were not successful. Despite divers from the state Department of Environmental Protection removing the plants, the milfoil was back to the same spot this year, and even more widespread.

Fortunately, the lake has devoted friends. The Pawtuckaway Lake Improvement Association, which samples and monitors the water, has been teaching volunteers how to look for and even eliminate the intruder. When the environmental organization noticed last year that there was some milfoil in the South Channel of the lake, they began an inspection and education program.

Because the plant grows so rapidly and easily, the association is pleading for residents to carefully inspect their boats. Volunteer and paid Lake Hosts are trained to inspect boats entering the water and training materials can be found as well at at the NH Lakes web page.

To protect Pawtuckaway before it is too late, the association has asked residents to take a few particular steps like cleaning, draining and drying boats that have been in other waterways. A picture on the association web page shows bushy branches and leaves that are unnaturally bright green, especially the younger plants. Milfoil_in_Flower_small

But unless it is a floating fragment, the association recommends boaters leave it in place and report the finding to them. Floating plant fragments can be removed and disposed of in zip lock bags. The association also asked homeowners to check the lake bottom as far from shore as possible and as often as possible, especially on sunny, calm days when visibility is good. And residents willing to do a bit extra are invited to train as weed watchers.

The markers my son and I saw were there to outline where the milfoil was found. All boating, paddling or swimming was discouraged in that area. Even small pieces of milfoil that break off from the larger plants can drift and easily take root, quickly overwhelming a water body, making water activities impossible.

Luckily, my son and I turned around when we saw the sign, there to help protect the waters from any further spread of milfoil.

-30-

Amy Miller works in the office of public affairs at EPA New England.

http://www.pawtuckawaylake.com/59-editorial-section/427-milfoil-alert-what-you-can-do-to-save-pawtuckaway

https://nhlakes.org/education/lake-host/


Editor's Note: The opinions expressed herein are those of the author alone. EPA does not verify the accuracy or science of the contents of the blog, nor does EPA endorse the opinions or positions expressed. You may share this post. However, please do not change the title or the content. If you do make changes, please do not attribute the edited title or content to EPA or the author.

EPA's official web site is www.epa.gov. Some links on this page may redirect users from the EPA website to a non-EPA, third-party site. In doing so, EPA is directing you only to the specific content referenced at the time of publication, not to any other content that may appear on the same webpage or elsewhere on the third-party site, or be added at a later date.

EPA is providing this link for informational purposes only. EPA cannot attest to the accuracy of non-EPA information provided by any third-party sites or any other linked site. EPA does not endorse any non-government websites, companies, internet applications or any policies or information expressed therein.

Taking Stock of EPA’s Work Helping the Mystic River

By Curt Spalding, Regional Administrator, US EPA New England

Today’s blog post celebrates the great work done by EPA and many partners to improve water quality in Boston’s urban waters. EPA has focused for more than two decades on improving the water quality here. It’s hard to overstate the turnaround in Boston Harbor, and the improvements to urban river watersheds like the Mystic and Charles are nothing short of remarkable.

The Mystic River offers a view of Boston.

The Mystic River offers a view of Boston.

While water quality improvements to the Charles River and Boston Harbor may get more attention, the work and the resulting advances in urban waters like the Mystic, have been equally impressive. A huge amount of progress has been made improving water quality in the Mystic River and the differences can be seen in communities throughout the watershed.

The Mystic suffered from high bacteria levels just like other urban waters such as the Charles and the Neponset. And in all three rivers, we used the same tools to tackle sources of bacterial contamination by aggressively enforcing the law to halt industrial pollution and the discharge of sewage mixed in with storm overflow. In each case, we eliminated illicit connections to storm drains, and found ways to limit stormwater pollution.

Our results speak volumes. This past summer, the water quality in the main stems of both the Mystic and Charles rivers were graded roughly equal. In the main stem of the Mystic (including Chelsea Creek, the fresh water and salt water portions of the river and the upper lakes), the water quality met Massachusetts water standards for boating and swimming over 86 percent of the time, and in the areas closer to Boston Harbor, the grade rises to nearly 90 percent of the time. These results are on par with the Charles River’s water quality grade of B+ this year for the main stem of the Charles. Some of the tributaries of the Mystic still need to see further improvement, and those areas are our focus.

EPA Regional Administrator announces 2016 Mystic River Report Card results.

EPA Regional Administrator announces 2016 Mystic River Report Card results.

Of course, the Mystic and the Charles each have different geography, development history, and vastly different population density. For example, the Mystic River is part of a large watershed, but contains a much smaller river stem. The challenges that exist in this river are heavily concentrated in the smaller tributaries that feed the river. The Mystic Watershed is far more densely populated, with about 6,600 people per square mile compared to 2,900 people per square mile in the Charles Watershed.

The differences among these rivers means EPA must tailor its work to respond to the unique characteristics of each river’s area and pollution sources. Our concerted work on the Charles began in the 1990s, and the lessons we learned there provided knowledge and experience that has brought faster improvements in other urban waters like the Mystic.

The power of the 44-year-old Clean Water Act has provided many of the tools EPA needed to achieve the superb results we have seen in Boston’s urban waterways. In 2007, EPA gave the Mystic a D for its first water quality grade. That year we also ordered the City of Revere to stop discharging pollutants into the Mystic watershed. Additional enforcement with several other Mystic municipalities, as well as the Suffolk Downs racetrack and a criminal prosecution of Exxon Mobil for a diesel spill followed. All of the municipal enforcement required the entities to identify and eliminate illicit discharges of pollutants to storm drains discharging to the Mystic River and its tributaries. And our enforcement cases have resulted in other valuable investments in the watershed. Resolution of the Exxon Mobil case provided over $2.6 million for environmental projects in the Mystic River and Chelsea Creek.  Another settlement provided over $1 million toward the 4.5 acre Condor Street Urban Wild along the heavily industrialized Chelsea Creek, providing an urban oasis for the citizens of East Boston.  And thanks to a settlement requiring installation of a boardwalk in Belle Isle Marsh, citizens will soon be able to explore the largest surviving salt marsh in Boston in greater detail.

Sun shines on the shores of the Mystic.

Sun shines on the shores of the Mystic.

If the Mystic River was going to get healthier, we knew it would need many champions. So, in 2009 EPA led the formation of a Mystic River Watershed Steering Committee. The Steering Committee, including community groups, nonprofit organizations, local, state and federal partners, since then has guided the improvements of the Mystic River Watershed, establishing strategy, priorities and key projects and actions needed to improve the Mystic. The focus of this group has certainly helped us realize the tremendous improvements we have seen on the Mystic, and they continue to work diligently on water quality improvement. For example, the Mystic River Watershed Association just received a national EPA Urban Waters grant to help create a multi-media stormwater education collaborative to increase awareness of stormwater pollution throughout the watershed.

EPA's Water Quality Monitoring Buoy collects and streams live water quality data on EPA’s Website (LINK: https://www.epa.gov/mysticriver).

EPA’s Water Quality Monitoring Buoy collects and streams live water quality data on EPA’s Website (LINK: https://www.epa.gov/mysticriver).

Another exciting development we are proud of is that in 2015, we launched a Mystic River water quality monitoring buoy in front of the Blessing of the Bay Boathouse in Somerville. The buoy measures water quality parameters including temperature, dissolved oxygen, pH, turbidity, specific conductance, and chlorophyll. The buoy is also used to monitor for and track cyanobacteria (blue-green algae) blooms. The data can be viewed by the public in near real time on our Mystic River website.

The data collected over the years, from a number of different partners, has informed the work done to improve water quality on the River. It contributes to our understanding of the River, which is especially important when tracking toxic algae blooms, a current EPA priority.  Algae blooms are often the result of excess nutrients entering the river, and this fall, we awarded an extensive technical assistance contract to help assess and reduce phosphorus entering the Mystic watershed.   This information will help guide future water quality projects in the area.

To improve water quality we also need better, flexible yet protective permits. Last April, we updated the Clean Water Act permit for small “Municipal Separate Storm Sewer Systems” (MS4s) in Massachusetts, including for the 21 communities within the Mystic Watershed. Better management of stormwater will protect rivers, streams, ponds, lakes and wetlands from pollutants, including elevated levels of nutrients.

Our work to improve conditions in the Mystic Watershed has extended beyond water quality. We’ve invested nearly $16 million in cleaning and developing formerly contaminated and abandoned sites known as brownfields. This work throughout greater Boston has brought life back to long abandoned sites with industrial pollution. We’ve also been cleaning Superfund sites along the Mystic River Watershed for decades. Two of the most famous sites we’ve cleaned – the Wells G&H and Industri-plex sites in Woburn – are in the Mystic River Watershed. Both have been and continue to be cleaned up and returned to productive use.

The Boston Harbor Cleanup was just the first step in EPA’s focus on cleaning waterways in the Greater Boston Area. We’ve all made tremendous strides to reduce direct bacterial pollution harming our urban rivers, even as these rivers are still in recovery from legacy pollution. The Mystic, Neponset and Charles River watersheds have robust watershed organizations employing citizen science and leveraging public/private partnerships. Still, more work lays ahead. The tributaries that feed all three rivers continue to be investigated for sources of pollution. We now understand that stormwater runoff is a major source of pollution to our waterbodies. EPA will continue its work towards healthier and cleaner watersheds that are a valued resource for the communities.


Editor's Note: The opinions expressed herein are those of the author alone. EPA does not verify the accuracy or science of the contents of the blog, nor does EPA endorse the opinions or positions expressed. You may share this post. However, please do not change the title or the content. If you do make changes, please do not attribute the edited title or content to EPA or the author.

EPA's official web site is www.epa.gov. Some links on this page may redirect users from the EPA website to a non-EPA, third-party site. In doing so, EPA is directing you only to the specific content referenced at the time of publication, not to any other content that may appear on the same webpage or elsewhere on the third-party site, or be added at a later date.

EPA is providing this link for informational purposes only. EPA cannot attest to the accuracy of non-EPA information provided by any third-party sites or any other linked site. EPA does not endorse any non-government websites, companies, internet applications or any policies or information expressed therein.

Partnering with States to Cut Nutrient Pollution

By Joel Beauvais

Nutrient pollution remains one of America’s most widespread and costly environmental and public health challenges, threatening the prosperity and quality of life of communities across the nation. Over the last 50 years, the amount of excess nitrogen and phosphorus in our waterways has steadily increased, impacting water quality, feeding harmful algal blooms, and affecting drinking water sources. From the Lake Erie algae blooms to the Gulf of Mexico dead zone, nutrient pollution is impacting every corner of our country and economy.

In 2011, EPA urged a renewed emphasis on partnering with the states and key stakeholders to accelerate the reduction of nitrogen and phosphorus pollution through state nutrient load reduction frameworks that included taking action in priority watersheds while developing long-term measures to require nutrient reductions from both point and non-point sources. Many states and communities have stepped up and taken action, supported with EPA financial and technical assistance. States have worked with partners to reduce excess nutrients and achieve state water quality standards in over 60 waterways, leaving nearly 80,000 acres of lakes and ponds and more than 900 miles of rivers and streams cleaner and healthier. And, in the Chesapeake Bay region, more than 470 wastewater treatment plants have reduced their discharges of nitrogen by 57 percent and phosphorus discharges by 75 percent.

We’ve made good progress but this growing challenge demands all hands on deck nationwide. Recent events such as the algae bloom in the St. Lucie Estuary in Florida and high nitrate levels in drinking water in Ohio and Wisconsin tell us we need to do more and do it now.

That’s why I signed a memorandum that asks states to intensify their efforts on making sustained progress on reducing nutrient pollution. EPA will continue to support states with financial and technical assistance as they work with their local agricultural community, watershed protection groups, water utilities, landowners, and municipalities to develop nutrient reduction strategies tailored to their unique set of challenges and opportunities.  Partnerships with USDA and the private sector – for example the Regional Conservation Partnership Program (RCPP) projects in Cedar Rapids, Iowa, and more efficient fertilizer use on sensitive lands such as in the Maumee River basin in Ohio – are yielding more rapid nutrient reductions in areas most susceptible to the effects of nutrient pollution. Private sector partnerships that engage the power of the food supply chain, such as the Midwest Row Crop Collaborative, hold much promise too.  Innovative permitting solutions are driving improvements.  For example, Boise, Idaho’s wastewater treatment plant permit that allows them to meet their nutrient limits in part by treating and reducing phosphorus in agricultural return flow in the nearby Dixie Drain at less cost to the taxpayers.  These examples and others show us that states, in cooperation with federal agencies and the private sector, can drive nutrient reduction actions.

To help states make further immediate progress, this year EPA will provide an additional $600,000 of support for states and tribal nutrient reduction projects that promise near-term, measurable nutrient load reductions.  This assistance will focus on public health threats from nitrate pollution in drinking water sources and harmful algal blooms in recreational waters and reservoirs.

With continued collaboration and partnership, I am confident we will make greater and quicker progress on achieving significant and measurable near-term reductions in nitrogen and phosphorus pollution.  In turn, we will support a more vibrant economy and improve public health for all.

Read more about EPA efforts to reduce nutrient pollution.


Editor's Note: The views expressed here are intended to explain EPA policy. They do not change anyone's rights or obligations. You may share this post. However, please do not change the title or the content, or remove EPA’s identity as the author. If you do make substantive changes, please do not attribute the edited title or content to EPA or the author.

EPA's official web site is www.epa.gov. Some links on this page may redirect users from the EPA website to specific content on a non-EPA, third-party site. In doing so, EPA is directing you only to the specific content referenced at the time of publication, not to any other content that may appear on the same webpage or elsewhere on the third-party site, or be added at a later date.

EPA is providing this link for informational purposes only. EPA cannot attest to the accuracy of non-EPA information provided by any third-party sites or any other linked site. EPA does not endorse any non-government websites, companies, internet applications or any policies or information expressed therein.

Healing Old Wounds

by Tom Damm

The day’s light was fading along with our chances of spotting a bull elk when out of the tall grass rose a pair of majestic antlers.  We quietly got out of our small caravan of cars, pointing and speaking in hushed tones.  The animal gave us a long, disinterested look and then ambled back down the hill.

Bull elk emerging from high grass

Bull elk appears for tour group

We had seen a scattering of elk cows and calves over the past half hour.  But the brief encounter with the antlered male was the perfect cap to a full day of touring old surface mines being restored in western Pennsylvania, including this popular state game land in Benezette Township known for its resurgent elk population.

Vast acres of the land before us had been scarred and abandoned by mining operators prior to a 1977 federal law requiring environmental remediation of active sites.  Now, after a series of re-mining and reclamation projects, our view was a sweeping vista of hilly forest and grasslands that serve as an attractive habitat for an elk herd 1,000 strong.

For our team of mostly federal and state regulators, the game land in Elk County was the last stop on Day 2 of a nearly week-long fact-finding tour arranged by EPA as part of a multi-agency effort to consider next steps for mine reclamation activity, including potential funding and other incentives.

Earlier in the day, Mike Smith, district mining manager for the Pennsylvania Department of Environmental Protection, led us on an often bumpy, dusty off-road tour of mining sites on either side of Route 80 between Snow Shoe and DuBois that similarly were abandoned and are now in various stages of re-mining and recovery.

In the reclamation process, operators receive permits to mine portions of the old sites that still have viable coal reserves in exchange for strategic and insured work that restores the full sites with trees and grasses and in many cases improves the quality of water impaired by acid mine drainage.

Most of the sites we saw were relatively small in size – not the type generally supported by a pool of money financed by industry and government to address mine-related safety and economic issues.

Two of the veteran operators said that with their thin, if not break-even profit margin this will be their last hurrah.  Said one, whose work included the elk-rich game lands, “When you look at this project and the good that it’s done, I don’t know who’s going to do this when we’re gone.”

But for this day, with roaming elk, a once-acidic stream segment stocked with trout, a former “moonscape” covered with grass, and even some head-bobbing wild turkeys, it was a time to appreciate the progress at hand.


About the Author: Tom Damm has been with EPA since 2002 and now serves as communications coordinator for the region’s Water Protection Division.

Editor's Note: The opinions expressed herein are those of the author alone. EPA does not verify the accuracy or science of the contents of the blog, nor does EPA endorse the opinions or positions expressed. You may share this post. However, please do not change the title or the content. If you do make changes, please do not attribute the edited title or content to EPA or the author.

EPA's official web site is www.epa.gov. Some links on this page may redirect users from the EPA website to a non-EPA, third-party site. In doing so, EPA is directing you only to the specific content referenced at the time of publication, not to any other content that may appear on the same webpage or elsewhere on the third-party site, or be added at a later date.

EPA is providing this link for informational purposes only. EPA cannot attest to the accuracy of non-EPA information provided by any third-party sites or any other linked site. EPA does not endorse any non-government websites, companies, internet applications or any policies or information expressed therein.

Citizen scientists test Warwick, RI, water

By Amy Miller

It’s not every day you can get your training as a citizen scientist with the regional administrator of the Environmental Protection Agency standing beside you. So residents of Warwick were pretty excited when Curt Spalding, administrator for EPA’s New England office, showed up for their one-day session on how to join professional scientists in keeping their region’s ponds healthy.

EPA scientist Hillary Snook, Regional Administrator Curt Spalding and Warwick Mayor Scott Avedisian participate in day of training for citizen scientists.

EPA scientist Hilary Snook, Regional Administrator Curt Spalding and Warwick Mayor Scott Avedisian participate in day of training for citizen scientists.

Spalding was pretty happy himself to be out there in the field, watching the work citizens are doing so they too can help out in reducing the amount of cyanobacteria, or blue-green algae, in local waterways. Curt is a big advocate of the program and loves the idea of hands-on citizens involvement, noted Hilary Snook, EPA New England’s lead scientist on this project.

Hilary and other EPA scientists have been traveling around New England this summer in a shiny white mobile lab, teaching citizens how they can play a part in monitoring for this bacteria, which is clogging our region’s and nation’s waterways. The team has already been to several locations around New England including White Pond in Concord, Mass. whose town beach was shut down for the entire 2015 season due to cyanobacteria.

Curt decided to tag along on the trip to Warwick, where a handful of citizens joined local, state and federal representatives for what turned out to be a rainy day of training at Gorton Pond, just behind the Warwick police station.

Warwickvisit2EPA’s new mobile laboratory was outfitted with the computers, microscopes and monitors that provide the on-site training. The mobile lab is designed to take people through all of the main parts of the program, with hands-on experience right at their local body of water.

A video presentation introduced the program to the group, with a so-called “Mi-Fi system” providing direct connection to webpages used for the program. Microscopes inside the vehicle let citizens identify samples taken from Gorton Pond and then upload them to citizen science databases.

Hilary showed volunteers how they could upload EPA’s bloomWatch app to their own devices then and there to submit photos of blooms.

The data collected by volunteers is useful for EPA and other environmental agencies trying to clean waterways and reduce bacteria levels. The system is simple enough that everyone from middle school students to academics and lake associations can participate.

EPA hopes added information will help determine where cyanobacterial blooms exist, whether they contain potential toxin producing species, and whether the existing blooms are toxic.

Through the Northeast Cyanobacteria Monitoring Program, volunteers were invited to get involved at three different levels. Besides the bloomWatch app, they can learn how to take water samples and then study them under a microscope. Some volunteers took home a kit that includes a microscope. Finally, volunteers can collect samples and then send them to EPA for further study using the program’s established protocols.

Citizen scientists in New England join volunteers around the country and world who are helping in this effort. Cyanobacteria blooms are caused mainly by nutrients, particularly phosphorus. With climate change and heavier rainstorms, more nutrients are running off the land into freshwater lakes and ponds. The toxins that can be produced by these bacteria can cause skin rashes and liver damage.

All of which means it’s important to Curt, it’s important to EPA and it’s important to all of us to address the increasing occurrences of harmful cyanobacteria blooms in our nation’s and region’s lakes and ponds.

-30-

Amy Miller works in the office of public affairs at EPA New England


More information is available at: https://blog.epa.gov/blog/tag/citizen-science/

Editor's Note: The opinions expressed herein are those of the author alone. EPA does not verify the accuracy or science of the contents of the blog, nor does EPA endorse the opinions or positions expressed. You may share this post. However, please do not change the title or the content. If you do make changes, please do not attribute the edited title or content to EPA or the author.

EPA's official web site is www.epa.gov. Some links on this page may redirect users from the EPA website to a non-EPA, third-party site. In doing so, EPA is directing you only to the specific content referenced at the time of publication, not to any other content that may appear on the same webpage or elsewhere on the third-party site, or be added at a later date.

EPA is providing this link for informational purposes only. EPA cannot attest to the accuracy of non-EPA information provided by any third-party sites or any other linked site. EPA does not endorse any non-government websites, companies, internet applications or any policies or information expressed therein.

Bay-Cationing

by Gwendolyn Supplee

My family has been vacationing on the southern eastern shore of Maryland at Janes Island State Park since 2013.  The first year, we had an almost one-year old daughter and weren’t quite comfortable getting out on the waters of the Tangier Sound with a little one.  So we enjoyed the beauty of the Bay from the land, but were still able to partake in many of the activities that make a “Bay-cation” so appealing, at least to us – fishing and crabbing!

As we began to plan our 2014 vacation, my husband suggested we buy a boat to really experience the Chesapeake Bay where it was meant to be enjoyed, on the water.  I was open to the idea, until he came home with a used boat he found with so much dirt, weeds, and small trees growing out of it, I wasn’t sure if he had purchased a boat or a planter for our front yard.  Alas, he got the boat sea-worthy for our trip, and we were able to experience the open Bay.

He’s made improvements to the boat every summer, and similarly, the Chesapeake Bay has shown some great improvements in many of its water quality indicators in the last several summers, as well.  That’s a big deal considering the impact of a cleaner Bay on the region’s economy, including drawing more families like mine to its shores.

Since 2010, the six Bay states and the District of Columbia have been taking significant steps to meet the clean water goals of the historic Bay TMDL “pollution diet.”   The TMDL is designed to reduce excess nitrogen, phosphorus and sediment that leads to murky water and algae blooms, Bay Crabblocking sunlight from reaching and sustaining underwater Bay grasses and creating low levels of oxygen for aquatic life, such as fish, crabs and oysters.

I eagerly read the reports about the outlooks for fishing and crabbing this July before we set out on vacation, and when we got to the park, we quickly made friends with our camping neighbor to learn the best spots for casting our poles and nets.

As a Marylander who frequents the waters of the Bay up and down the Eastern Shore, our new friend commented the Bay had the best clarity and abundance of Bay grasses he had seen in years, and expressed optimism that the cleanup seemed to be working.  The next day we reeled in a male blue crab, 6 ¼” point to point, and had to agree, things on the Bay, especially our nightly vacation dinners with crab on the menu, were definitely looking up!

Check out this site for some simple ways to help restore the Bay and keep those blue crab meals coming.


About the Author: Gwendolyn Supplee is a Life Scientist who has been with EPA for six years and currently works in the Air Protection Division. In her spare time, she enjoys exploring the outdoors on land and on the water with her family.

Editor's Note: The opinions expressed herein are those of the author alone. EPA does not verify the accuracy or science of the contents of the blog, nor does EPA endorse the opinions or positions expressed. You may share this post. However, please do not change the title or the content. If you do make changes, please do not attribute the edited title or content to EPA or the author.

EPA's official web site is www.epa.gov. Some links on this page may redirect users from the EPA website to a non-EPA, third-party site. In doing so, EPA is directing you only to the specific content referenced at the time of publication, not to any other content that may appear on the same webpage or elsewhere on the third-party site, or be added at a later date.

EPA is providing this link for informational purposes only. EPA cannot attest to the accuracy of non-EPA information provided by any third-party sites or any other linked site. EPA does not endorse any non-government websites, companies, internet applications or any policies or information expressed therein.

Bridge soars over restored Maine river

By Amy Miller

I was driving south on Maine’s coast checking out Down East’s picturesque seaside towns when a bridge appeared through the fog, quite like Oz on the horizon. This was not the covered bridge of a quaint New England town, nor the familiar antiquated railroad bridge. This was a looming modern

The observatory of the Penobscott Narrows Bridge can be reached through the Fort Knox Historic Site.

The observatory of the Penobscott Narrows Bridge can be reached through the Fort Knox Historic Site.

structure more reminiscent of the Zakim Bridge into Boston. The closer we got the more I wondered at the size and stark beauty of this structure.

As it turns out, my husband and I were heading toward the 2,120-foot long Penobscot Narrows Bridge, and for good reason it conjured the Zakim. This 10-year-old bridge is one of only three of its kind in the world: constructed with a cradle system that carries the strands within the stays from bridge deck to bridge deck. The other two bridges of this kind are the Zakim and the Veterans’ Glass City Skyway in Toledo, Ohio.

Towering 420 feet over the town of Bucksport, the bridge’s public observation tower is also the only public bridge observatory in the country and one of four in the world (the others are in China, Slovakia and Thailand). The tallest of the four, it is reached by the fastest elevator in northern New England and gives you 360-degree views of Maine’s coastline, islands and lots of hills and mountains.

But just as impressive as these views is the far less visible but no less superlative accomplishments flowing below the span. The 109-mile Penobscot River tells the story of America’s environmental tragedies, as well as the equally compelling stories of how health and beauty can be restored to our waterways.

The restoration of the Penobscot involved an unprecedented effort to remove two dams and build a state-of-the-art fish bypass around a third. In addition to the Howland Dam bypass, the Milford Dam has a state-of-the-art fish lift installed as part of the restoration project.

A bypass was created for fish around the Howland Dam.

A bypass was created for fish around the Howland Dam.

As a result, hundreds of miles of habitat along the Penobscot and its tributaries have been restored, opening the way for sea-run fish, helping the ecology as well as the communities along the river.

In 1999 when Pennsylvania Power and Light purchased a series of dams in Maine, the company approached the Penobscot Indian Nation and several conservation organizations with the idea of working together to relicense the dams. Four years later the company announced it would remove dams along the lower part of the river while keeping hydropower upriver.

The non-profit Penobscot River Restoration Trust was formed, including the Penobscot Indian Nation and six environmental groups — American Rivers, Atlantic Salmon Federation, Maine Audubon, Natural Resources Council of Maine, The Nature Conservancy and Trout Unlimited, who worked with a variety of state and federal agencies, including EPA, on the restoration project.

The Trust in 2010 purchased the Veazie, Great Works, and Howland dams. The first two were removed and a bypass was created around the Howland Dam in 2015 marking the end of this model restoration program.

Before the 1830s, there were no dams on the Penobscot and Atlantic salmon ran upstream in schools numbering 50,000 or more. Shad and alewives migrated 100 miles upriver. Twenty-pound striped bass and Atlantic sturgeon also swam into the river.

Since the restoration, fish have retraced those routes. The salmon run today is considerably smaller than it had been, but still qualifies as the country’s largest Atlantic salmon run. And the population is likely to grow. As this happens, other wildlife that feeds on migrating fish will also do better.

When the restoration is over, 11 species of sea-run fish will have renewed access to habitat that runs from Maine’s high point on Katahdin down to the bay near the Penobscot Narrows Bridge, though not all the species may make it to Katahdin.

The Penobscot Indians fished for American shad as long as 8,000 years ago and sturgeon 3,000 years ago. The logging, dams, and industry along the river put thousands of years of activity to a stop by the 1950s.

Only a generation ago this river was regarded as one of American’s most endangered. It is now considered one of America’s most significant river-restoration efforts.

As you stand in the observatory, turning to look out in 360 degrees, remember to look down at the Penobscot. Sometimes the biggest changes lurk beneath the surface.

http://maine.gov/mdot/pnbo/

http://bangordailynews.com/2016/06/14/outdoors/hundreds-celebrate-completion-of-penobscot-restoration-project/

http://www.penobscotriver.org/

Amy Miller is in the public affairs office of EPA’s New England office.

Editor's Note: The opinions expressed herein are those of the author alone. EPA does not verify the accuracy or science of the contents of the blog, nor does EPA endorse the opinions or positions expressed. You may share this post. However, please do not change the title or the content. If you do make changes, please do not attribute the edited title or content to EPA or the author.

EPA's official web site is www.epa.gov. Some links on this page may redirect users from the EPA website to a non-EPA, third-party site. In doing so, EPA is directing you only to the specific content referenced at the time of publication, not to any other content that may appear on the same webpage or elsewhere on the third-party site, or be added at a later date.

EPA is providing this link for informational purposes only. EPA cannot attest to the accuracy of non-EPA information provided by any third-party sites or any other linked site. EPA does not endorse any non-government websites, companies, internet applications or any policies or information expressed therein.

Three Ways Climate Change is Harming Marine Species

By Brittany Whited

Earth’s average temperature has risen by 1.5°F over the past century. EPA’s Climate Change Indicator project tracks changes in our environment related to this warming, including observable changes on land like wildfire severity, snowfall, and heavy precipitation. A new indicator on marine species released in the 4th Edition of EPA’s Climate Change Indicators in the US report shows that marine ecosystems are also feeling the heat. We may not be able to “sea” it, but climate change is also affecting our oceans. What does this mean for fish and other marine species?

1. Oceans are getting hotter. Changes in water temperature can affect the environments where fish, shellfish, and other marine species live. As climate change causes the oceans to become warmer year-round, populations of some species may adapt by shifting toward cooler areas.

According to the fourth edition of EPA’s Climate Change Indicators in the United States report, American lobster, black sea bass, red hake, and over a hundred other populations of marine species have already shifted north to cooler waters. And we’re not talking a mile or two – in fact, these three economically important species have shifted their average center of biomass northward by an average of 109 miles over just 32 years. For all 105 marine species studied, the average center of biomass along U.S. coasts shifted northward by about 12 miles between 1982 and 2014. At the same time, these 105 species moved an average of 18 feet deeper.

2. Oceans are becoming more acidic. The acidity of seawater is increasing as a direct result of increasing carbon dioxide levels in the air from human activities, like burning fossil fuels. Concentrations of carbon dioxide are higher than in the last 800,000 years. Carbon dioxide dissolves in water, changing seawater chemistry and decreasing pH (making seawater more acidic). The ocean’s increased acidity results in thinner shells and more shellfish die as they become easier for predators to eat.

Corals are also very sensitive to rising acidity, as it is difficult for them to create and maintain the skeletal structures needed for their support and protection. Corals provide vital fish spawning habitat and support for thousands of marine species. EPA’s Climate Change in the United States: Benefits of Global Action states that without action on climate change, dramatic loss of shallow coral cover is predicted to occur. For example, coral cover in Hawaii is projected to decline from 38% (current coral cover) to approximately 5% by 2050 without significant global action on climate change.

3. More severe storms and precipitation can pollute coastal waters. Warmer oceans increase the amount of water that evaporates into the air. When more moisture-laden air moves over land or converges into a storm system, it can produce more intense precipitation—for example, heavier rain storms. Heavy rain in coastal areas can lead to increases in runoff and flooding, impairing water quality as pollutants on land wash into water bodies. Some coastal areas, such as the Gulf of Mexico and the Chesapeake Bay, are already experiencing “dead zones” – areas where water is depleted of oxygen because of pollution from agricultural fertilizers, delivered by runoff. The phrase “dead zone” comes from the lack of life – including fish – in these waters.

Click to learn what EPA is doing to mitigate climate change and protect ocean water quality and marine species.

About the Author: Brittany Whited is an Oak Ridge Institute for Science and Education (ORISE) participant hosted by the Climate Science and Impacts Branch in the EPA’s Office of Atmospheric Programs. She recently completed her Master’s degree in Public Health from George Washington University and is wicked excited to spend less time studying and more time outside.

Editor's Note: The opinions expressed herein are those of the author alone. EPA does not verify the accuracy or science of the contents of the blog, nor does EPA endorse the opinions or positions expressed. You may share this post. However, please do not change the title or the content. If you do make changes, please do not attribute the edited title or content to EPA or the author.

EPA's official web site is www.epa.gov. Some links on this page may redirect users from the EPA website to a non-EPA, third-party site. In doing so, EPA is directing you only to the specific content referenced at the time of publication, not to any other content that may appear on the same webpage or elsewhere on the third-party site, or be added at a later date.

EPA is providing this link for informational purposes only. EPA cannot attest to the accuracy of non-EPA information provided by any third-party sites or any other linked site. EPA does not endorse any non-government websites, companies, internet applications or any policies or information expressed therein.

EPA and USDA Pledge Actions to Support America’s Growing Water Quality Trading Markets

By Ann Mills, USDA Deputy Under Secretary for Natural Resources and Environment and Ellen Gilinsky, EPA Office of Water Senior Policy Advisor

In September of 2015, EPA and USDA sponsored a three-day national workshop at the Robert B. Daugherty Water for Food Institute in Lincoln, Nebraska that brought together more than 200 experts and leaders representing the agricultural community, utilities, environmental NGOs, private investors, states, cities, and tribes to discuss how to expand the country’s small but growing water quality trading markets. Recently we released a report that summarizes the workshop’s key discussions and outlines new actions that we and others will take to further promote the use of market-based tools to advance water quality improvements.

Over the last decade, states and others have discovered that they can meet their water quality improvement goals through lower costs and greater flexibility by using a voluntary water quality trading program. Trading is based on the fact that sources in a watershed can face very different costs to control the same pollutant. Trading programs allow facilities facing higher pollution control costs (like a wastewater treatment plant or a municipality with a stormwater permit) to meet their regulatory obligations by purchasing lower cost environmentally equivalent (or superior) pollution reductions (or credits) from another source, including farms that use conservation practices to efficiently reduce the movement of nitrogen, phosphorus and sediment from their fields into local waterways. For example, Virginia’s nutrient trading program to offset stormwater phosphorous loads from new development has saved the Commonwealth more than $1 million in meeting state water quality goals while providing economic incentives to local agricultural producers to reduce soil erosion and runoff.

It’s a proven approach that creates new revenue streams for America’s farmers and ranchers while delivering significant environmental results.

While relatively few robust state and tribal water quality trading programs are in existence today, there is growing interest in markets as a tool for achieving water quality and ecosystem sustainability goals.

Our report summarizes the primary obstacles to market expansion and participants’ recommendations on how to simplify development of trading markets in their states.

It also captures the participants’ recommendations to the Administration on steps it can take to promote the use of environmental markets and water quality trading, which include:

  • Supporting a national dialogue series over the next three years, convened by the National Network On Water Quality Trading, to advance collective understanding of water quality program design, implementation, and operation across sectors and communities;
  • Increasing state awareness of water quality trading, through support of the  Association of Clean Water Administrators working directly with state agencies;
  • Highlighting successful trading programs that have attracted private capital, or are otherwise financially sustainable;
  • Compiling a list of known, voluntary conservation program design frameworks that use market-like approaches;
  • Pursuing efforts to develop a national registry for water quality trading programs;
  • Forming a stakeholder group to develop a list of tools that meet the minimum requirements of the federal and state agencies that must verify trades Increase targeted stakeholder engagement; and,
  • Working with federal and state partners to actively engage in locations where increasing participation in market-based programs may result in more rapid nutrient decreases to address immediate problems such as harmful algal blooms.

These recommendations complement the USDA-EPA Water Quality Trading Roadmap and EnviroAtlas, products our agencies have jointly developed to simplify stakeholders’ efforts to establish their own trading markets.

States, communities, and farmers and ranchers who’ve championed this innovative idea are creating momentum for others to follow.  We look forward to supporting the expansion of these markets to help  America more efficiently protect its water quality while supporting a vibrant agricultural economy in communities nationwide.

For more information, visit the USDA Environmental Markets website and EPA’s Water Quality Trading website.

Editor's Note: The views expressed here are intended to explain EPA policy. They do not change anyone's rights or obligations. You may share this post. However, please do not change the title or the content, or remove EPA’s identity as the author. If you do make substantive changes, please do not attribute the edited title or content to EPA or the author.

EPA's official web site is www.epa.gov. Some links on this page may redirect users from the EPA website to specific content on a non-EPA, third-party site. In doing so, EPA is directing you only to the specific content referenced at the time of publication, not to any other content that may appear on the same webpage or elsewhere on the third-party site, or be added at a later date.

EPA is providing this link for informational purposes only. EPA cannot attest to the accuracy of non-EPA information provided by any third-party sites or any other linked site. EPA does not endorse any non-government websites, companies, internet applications or any policies or information expressed therein.

The future holds a cleaner Lake Champlain

By Curt Spalding

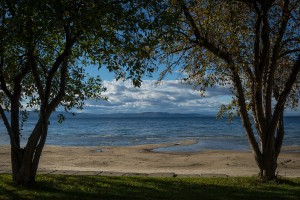
To stand at the edge of Lake Champlain, looking at the rich blue water in the foreground and the Adirondack mountaintops in the background, is to behold one of New England’s most beautiful landscapes.

On a brilliant summer day, I have seen anglers trolling here for bass, sailors riding the wind and Champlain4children frolicking along the shores. I have seen the commerce that comes with half a million tourists and commuters who are ferried across the lake to New York each year.

But for years, this exquisitely beautiful source of economic growth, local pride and drinking water for 145,000 people has been compromised by too much phosphorus. Runoff from farms, rooftops, parking lots, roads, and forests, eroding stream banks and discharges from wastewater treatment facilities have all added to phosphorus overload.

Most of our regions’ lakes, rivers and streams contain some amount of naturally occurring phosphorus. But each waterbody can hold only so much phosphorus before it creates an ecosystem choked with algae that suffocates wildlife and makes waters unsafe for swimming. Lake Champlain has been over its limit for decades now, especially in the narrow, southern portion of the lake, and St. Albans and Missisquoi Bays.

However, we have reason to feel assured that the future will bring a cleaner and healthier Lake Champlain. This month my colleagues at EPA issued the final version of a new plan that spells out how much phosphorus the various parts of this lake can support. This document, called a “Total Maximum Daily Load” plan sets new required pollution reduction targets for the Vermont sources of phosphorus to the 120-mile-long lake that separates northwestern Vermont from northeastern New York.

Cham[plain2The new limits, along with a state law passed last year give the state responsibility for reaching the targets, and for coming up with the controls necessary for achieving these goals. I have watched state and environmental leaders work long and hard to shape the plans and policies and I am confident that the programs, regulations and permits they are now working to put in place will succeed in reducing phosphorus levels from farms, commercial developments, roads, and forests.

The new limits were developed in collaboration with the Vermont Agency of Natural Resources, the Department of Environmental Conservation, the Vermont Agency of Agriculture, Food and Markets and the Vermont Agency of Transportation, who each have a role in the success of this plan. The new plan reflects years of work and input from many organizations and people across the Lake Champlain basin.

While the new limits are a major milestone on the path to reducing phosphorus pollution in Lake Champlain and in preventing the algae blooms, much work still has to be done to make the lake as healthy as it can and should be. Nearly everybody who lives, works or vacations in the basin contributes to the problem in some way and it will take an “all in” effort to bring the lake back to good health. Our EPA staff will be there to help our partners and ensure we achieve the desired levels. And we’ll issue report cards to help all of us and the public keep track of the progress.

One of my biggest joys in working at the New England office of the Environmental Protection Agency is witnessing the restoration of our beautiful lakes. Lake restoration happens slowly and requires effort over many years, particularly for large lakes like Lake Champlain, but I’m optimistic that the key ingredients are in place to bring about gradual recovery of this special body of water.

-30-

Curt Spalding is regional administrator of EPA’s New England office.

Editor's Note: The opinions expressed herein are those of the author alone. EPA does not verify the accuracy or science of the contents of the blog, nor does EPA endorse the opinions or positions expressed. You may share this post. However, please do not change the title or the content. If you do make changes, please do not attribute the edited title or content to EPA or the author.

EPA's official web site is www.epa.gov. Some links on this page may redirect users from the EPA website to a non-EPA, third-party site. In doing so, EPA is directing you only to the specific content referenced at the time of publication, not to any other content that may appear on the same webpage or elsewhere on the third-party site, or be added at a later date.

EPA is providing this link for informational purposes only. EPA cannot attest to the accuracy of non-EPA information provided by any third-party sites or any other linked site. EPA does not endorse any non-government websites, companies, internet applications or any policies or information expressed therein.