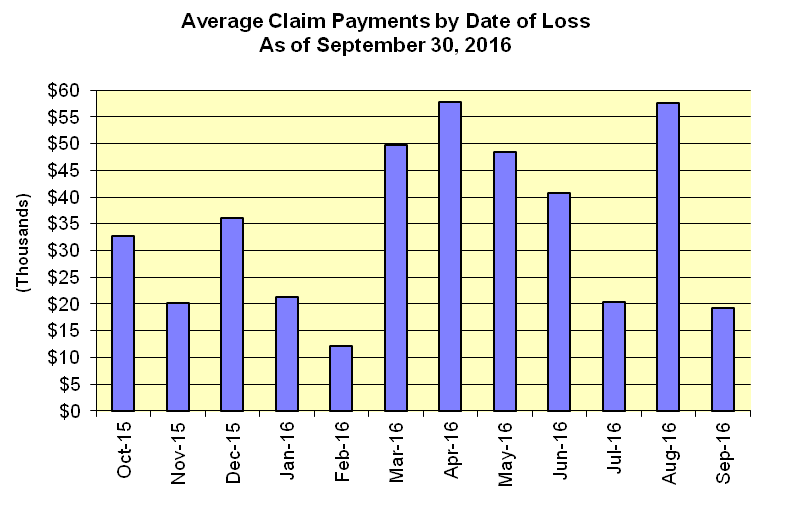
On this page you will find a bar chart and data table displaying the average amount paid on flood insurance claims by month and year of loss. The data is displayed for a rolling 12-month period ending with the current month's data and it is updated monthly.
| Date of Loss | Average Paid on Paid Losses |
|---|---|
| Oct-15 | 32,652 |
| Nov-15 | 20,254 |
| Dec-15 | 36,037 |
| Jan-16 | 21,316 |
| Feb-16 | 12,129 |
| Mar-16 | 49,739 |
| Apr-16 | 57,760 |
| May-16 | 48,503 |
| Jun-16 | 40,670 |
| Jul-16 | 20,327 |
| Aug-16 | 57,592 |
| Sep-16 | 19,278 |
Last Updated:
11/15/2016 - 16:20