This page contains a series of interactive visualizations that allow you to explore our data.
Start with this first visualization if this is your first time to this page.
 Summary of Disaster Declarations and Grants. See the Federal declared disasters that have occurred in your state or territory. Then view a summary of our support for fire, preparedness, mitigation, individual assistance, and public assistance grants.
Then learn more by interacting with these visualizations.
 Disaster declarations for states and counties. Explore historic federal disaster declarations by state, county, hazard, and year.
 Disaster declarations for Tribal Nations. Explore historic federal disaster declarations by Tribal nation, hazard, and year.
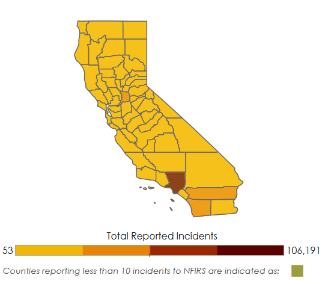 Fire Incidents for States and Counties. Explore state and county National Fire Incident Reporting System (NFIRS) data, a reporting standard that fire departments use to uniformly report on the full range of their activities.
 Disaster Housing Assistance. Explore FEMA’s Individual and Household Program data and the Small Business Administration’s Disaster Home Loan Program data by state, county, and disaster.