Training
Joint DOT/FHWEA Major Project Webinar (October 2014) - Transcript
October 28, 2014
Download the PDF
Read the transcript
Listen to the webinar
FHWA Center for Innovative Finance Support Project Delivery Team
Agenda
- Major Project Spotlight
- Major Project Information
- Comments/Questions
Major Project Spotlight: DOT/FHWA Peer Exchange
Peer Exchange Featuring:
Addressing Environmental Concerns on Major Projects - NH DOT
WSDOT's Cost and Schedule Risk Assessment - WA DOT
Disadvantaged Business Enterprise (DBE) Goals for Major Projects - NYSTA
Addressing Environmental Concerns on Major Projects
Pete Stamnas
Ron Crickard
New Hampshire DOT
Video: https://www.youtube.com/watch?v=wlbxl-yqmYU&feature=youtu.be
 Scope of Work
- Widen 20 miles of Interstate 93 from state line to I-293 split in Manchester
- Reconstruct/Modernize Exits 1-5
- Work on 45 bridges (23 new)
- 19 on "red list"
- Construct 3 new park & ride lots at Exits 2, 3, & 5 and expand bus service
- Construct 5 miles of sound walls at 12 locations along the corridor
Project Cost Estimate
- Total Estimated Cost - $750M
- Construction - $563M
- Engineering - $86 M
- ROW - $73M
- Mitigation - $28M
Project Milestones
- November 2002 - Public Hearings
- April 2004 - FEIS Published
- June 2005 - Record of Decision
- June 2005 -Final Design NTP
- June 2006 - State Permits
- March 2007 - ACOE Permit
- June 2007 - Construction Begins
- August 2007 - CLF Court Decision
- May 2010 - FSEIS Published
- Sep. 2010 - SROD Issued
Impacts/Mitigation
- 1000 Acres conservation lands
- 985 acres of preservation
- 15 acres creation
- $22 M to acquire/create
- $3.0 M - Drinking Water protection
- $3.5 M - Growth planning
Environmental Concerns
Secondary growth
Alternative Modes
Water Quality
- Wetland impacts
- Chloride impaired streams
- Incremental implementation of selected alternative
- Permanent stormwater management
- No net increase TSS,TN, TP
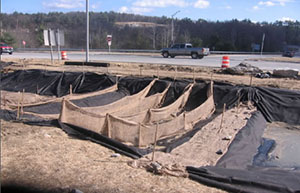
- Construction stormwater management??????
 Construction: Exits 2 & 3
- 5 construction projects - $160 million
- Reconstruct 5 miles mainline & 2 Exits
- 2.2 M cy embankment
- 1.5 M cy rock excavation
- 1.6 M cy common excavation
- Construction began 2008
- 2 projects complete - $55 M
- 3 projects active - $105 M
- 2016 completion
Proposed Condition
- Exit 3 - Overview
- Route 111 to be relocated
- Route 111a to be relocated
- Northbound lands to be shifted to the west

View larger version of Exit 3 Overview map
 Permanent Stormwater BMP's
Exit 3
- Constructing 26 treatment structures
- Collecting runoff from over 85% of all paved surfaces
- Installing shutoffs for hazardous spill containment
- Net reduction in nutrients in runoff TSS, TP, TN
Permanent Stormwater BMP's
Expected Nutrient Reductions for Exit 3 Area
- TSS reduced by 23,500 lbs/year
- Total phosphorous reduced by 45 lbs/year
- Total nitrogen reduced by 310 lbs/year
Sensitive Water Bodies
- Cobbets Pond (Class B)
- Impairments
- Chlorophyll-a
- Cyanobacteria hepatotoxic microcystins
- Dissolved oxygen saturation
- Phosphorus (Total)
- Canobie lake (Class A)
- Public drinking water supply
NH Water Quality Standards
- Class B waters:
- 10 Nephelometric turbidity units (NTU) above naturally occurring.
- Class A waters:
- 0 NTU above naturally occurring.

Major Storm Events = Change

2008 - "An ice storm on December 12 knocked out power to 1.4 million people in upstate New York, Massachusetts, New Hampshire and Maine. President George W. Bush declared a state of emergency in New Hampshire."
Major Storm Events = Change
- Ice storm event led to:
- Increased oversight from regulatory agencies.
- Better communication with lake associations.
- DOT New approach

Temporary Erosion Control & Stormwater Management (New)
- "Erosion control is a top priority"
- DOT completes extensive engineering prior to construction for TEC & stormwater management efforts (Stormwater Analysis)
- Contractor better prepared to develop and implement SWPPPs more detailed
- Stakeholders are invited and participate in weekly Erosion Control meetings
- Focus on sediment control new EC tools/strategies
- EC costs begin to rise
- I-93 Sediment Control Strategies
- Water diversion
- Stabilization
- Sediment capture
- Stormwater detention
- Stormwater discharge
March 2010 events
From the National Weather Service:
"The third of three significant successive nor'easters to affect the northeastern United States struck on 29-30, March 2010. The combined effects of these storms, the first occurring on 13-14 March, another on 22-24 March 2010, produced many new monthly rainfall records in southern New England. The monthly total at Logan was 377.7 mm (14.87 inches) making March 2010 the wettest March on record."

Quotes After the Storm
- "Crews were here all weekend trying to deal with it," Levine said. "We ran out of places to store the water." (Jay Levine, NHDOT)
- "I think they could do better without spending significantly more," Schroeder said. "They either need more storage capacity or the ability to move water around better." Bill Schroeder (Canobie Lake)
Led to New Tools for Sediment Control on I-93
- Polyacrylamide (PAM) as a soil stabilizer
- Stormwater treatment with flocculants
- Mixing Zones
Polyacrylamide as Soil Stabilizer
Benefits
- Reduces soil loss 94%
- Improves Soil Structure
- Increases Microorganisms
- Increases infiltration 15%
- Effective Stormwater BMP
- Reduces Sediment and Nutrients in Runoff
Environmental Aspects
- Non toxic in soil &water
- >10 fold conc. safety factor
- Little Effect on pH
- No PAM accumulation
In-Ground Flocculant Treatment System

In-Ground Flocculant Clarifier
Flocculant Dosing Tank System

Flocculant Dosing Tank System (Blocks)

Current Flocculant treatment method

Current Flocculant treatment method

The Jar Test

Costs $$$$
Completed contracts:
| |
Erosion control $$$
Percent of Contract |
Final |
| Windham 13933K |
1.6% |
8.2% |
| Windham 13933G |
6.1% |
11.6% |
| Windham 13933F |
5.4% |
15.0% |
| Salem 13933D |
10.0% |
7.4% |
On going contracts:
| |
Percent of Contract |
To Date |
| Windham 13933I |
11.3% |
5.4% |
| Salem 13933E |
10.4% |
4.9% |
| Windham 13933H |
10.9% |
0.0% |
I-93 Temporary Erosion Control & Stormwater Management Lessons Learned
- Completing a construction stormwater assessment during design of large projects pays dividends
- Identifies potential risks early
- Allows items to be included in the contract to minimize/mitigate risk potential and costs
- Contractors are more prepared
- Reduces time to prepare SWPPP - work can start sooner
- Water diversion is critical keep clean water out of the active construction zone
- Construct temporary sedimentation basins as early as possible (NHDOT acquiring temp easements)
- The construction site is constantly changing
- Strategies that work one month may not work as well the following month
- Be vigilant
- Anionic polyacrylamides (PAMs) are effective in reducing turbidity in construction runoff
- Flocculant treatment systems
- Soil binders/stabilizers with PAM applied to open areas to minimize erosion potential
- Having a full EC tool box is critical to maintaining water quality
- Anionic polyacrylamides (PAMs) are safe for the environment when used properly
- Reduces soil loss
- Reduces phosphorous levels in treated stormwater
- Negligible effect on pH of the water
- Lowers biochemical oxygen demand in runoff
Contact Information
Pete Stamnas
I-93 Project Manager
New Hampshire DOT
PStamnas@dot.state.nh.us
Ron Crickard
Chief, Project Management Section
New Hampshire DOT
rcrickard@dot.state.nh.us
Questions & Input
Submit a question using the chat box
Major Project Spotlight: WSDOT's Cost and Schedule Risk Assessment
Ovidiu Cretu
Washington State DOT
WSDOT's Cost and Schedule Risk Assessment
- WSDOT Project Management (PM)
- Short history of the WSDOT process of Risk Assessment (RA)
- RA process overview
- Definition
- Scalability
- Resources required
- Benefits
- Lessons learned
- Develop in-house expertise
- Risk reserve
- Risk Treatment Planning
- Innovations at WSDOT Risk Assessment
- Combine Value Engineering with Risk Assessment (VERA)
- Number of risks
- Market conditions
- Risk's conditionality
- Risk's severity
WSDOT Project Management

View larger version of flow chart
Risk Management Cycle

View larger version of risk management cycle chart
Twelve Years of Risk Assessment
"CEVP® (risk-based analysis) was developed to address risk and uncertainty - very useful results"
"...transportation department efforts to plan more accurately and manage money more effectively ... So give DOT some"
"Giving citizens a range of costs, including full disclosure of the variables, is not only politically smart, but it's common sense" - Seattle Post-Intelligencer, June 2002
Methods of delivery of project risk assessment:
- Started with Cost Estimating Validation Process (CEVP) in 2002
- Projects above $100 million
- Requires External Subject Matter Experts
- Added the Cost Risk Assessment (CRA) in 2003
- Projects between $25 and $100 million
- May be done with only WSDOT participants
- Combined Value Engineering and Risk Assessment (VERA) in 2005
- Projects over $25 million and bridges over $20 million
- Any other Projects that may benefit from VERA
- Requires External Subject Matter Experts

View larger version of the chart
"The time is always right to do the right thing." - Martin Luther King Jr.
Risk Assessment - Process overview
- Definition - is a systematic cost and schedule review that incorporates the effect of uncertainties upon project's objectives.
The risk assessment must provide actionable data that may optimize the project objectives.
- Scalability - the level of effort varies depending on project's magnitude and complexity
- Resource required - is represented by a wide range (minimal when the workshop is produced in-house and tens of thousands of dollars when consultants are involved)
- Benefits:
- Better understanding of project's objectives
- Minimizes surprised
- Provides data for optimizing the project's objectives
Risk Assessment - Lessons learned
- Develop in-house expertise
- Human resource - dedicated team that should have a passion toward understanding and enhancing the process of risk management
- Tools develop tools that are applicable towards department needs.
- Simulation model,
- Communication tools
- Collaborate with consultants
Lessons learned - Risk Reserve
Risk Reserve = Legslative Budget - Operational Budget

View larger version of the risk reserve graph
Risk Management Cycle
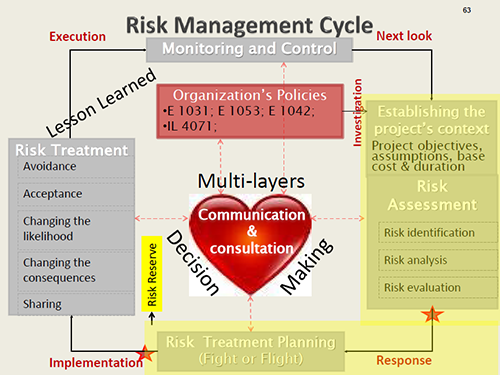
View larger version of the risk management cycle graphic
Risk Assessment - Lessons learned
- Risk Treatment Planning
- It allows the project team to digest the information obtain from the risk workshop and to decide on risk treatment strategies.
- It provides better raw data (cost, schedule and risks) for risk analysis.
- The cost risk profile is more accurate
- It initiates the implementation of risk treatment strategies.
Risk Assessment - Innovations
- Combined Value Engineering with Risk Assessment (VERA) - represents the most efficient process of risk assessment. It was used for projects ranging from less than

View larger version of the Value Engineering with Risk Assessment chart
Risk Assessment - Innovations
- Number of risks - we recommend the assessment of only significant risks. When a significant risk occurs it will require supplemental intervention.
- Market Conditions - we found the MC may be the most important driver of the construction cost. MC is driven by the expected number of bidders on the project.
Comparison of the Low Bid vs. the Estimate
Based on Number of Bidders

View larger version of the comparison graph
Risk Assessment - Innovations
- Risk's conditionality
- Dependency - every risk must be evaluated in relationship with other risks.
- Correlation - must be justified and documented. Correlation is a powerful way of increasing the cost distribution range and sometimes is abused.
- Project risks map comprehensive visual representation of the project risks
Traditional Tornado Diagram
Candidates for Cost Risk Management (pre-mitigated)

View larger version of the chart
Risks Map

View larger version of the risks map graph
WSDOT's Risk Assessment Conclusions
- WSDOT has over 12 years experience in the field of project risk assessment
- WSDOT uses a scalable approach of risk management
- WSDOT has developed the VERA process
- WSDOT has improved the risk assessment process based on its research and lessons learned.
Contact Information
Ovidiu Cretu
Cost Estimating & Risk Analysis Supervisor
Washington State DOT
CretuO@wsdot.wa.gov
Questions & Input
Submit a question using the chat box
Major Project Spotlight: Disadvantaged Business Enterprise (DBE) Goals for Major Projects
Tracey Mitchell
New York State Thruway Authority
Christine Thorkildsen
FHWA - New York Division
Agenda
- Project Background
- Project Overview
- Disadvantaged Business Enterprise (DBE) Goal Development
- New York State Thruway Authority (Thruway) DBE Compliance Program
- Collaboration of Stakeholders
- DBE Program Management Tools
- Q & A
New NY Bridge Background
Project of National Significance... DBE Goal Set at $314M
- Replaces Existing Tappan Zee Bridge
- Presidential Initiative Project
- Largest Transportation Infrastructure Finance and Innovation Act (TIFIA) Loan Closed in US DOT History
- Largest Active Federal Highway Administration (FHWA) Design Build (DB) Project in the Country
- Largest Ever DB Project in the State of New York
- Largest Ever Dollar Value DBE Goal for FHWA Project

Thruway Partners & Compliance Team
- The New NY Bridge
- U.S. Department of Transportation Federal Highway Administration
- Office of Governor Andrew Cuomo
- New York Thruway
- US Dept. Of Labor
- NYS DOT
- NYS Department of Labor
- EnTech Engineering, P.C.
- DACK
- NYS Inspector General
- US Inspector General

TZC Team Including Compliance Consultants
- Tappan Zee Constructors, LLC
- Fluor
- Granite
- American Bridge
- Traylor Bros, Inc
- HDR
- Buckland & Taylor Ltd, Bridge Engineering
- URS
- GZA
- JHC
- ARG - Armand Resource Group, inc.
- McKissack

Construction schedule: 5 Years, 2.5 Months
Bridge Completion: July 2018
Contract Cost: $3.14 Billion
FHWA Initial Involvement
| Presidential Initiative |
- Designated by President Obama
- High priority, job-creating project
- Expedited review/approval process
|
| "Federalizing" the Project |
|
| Setting the DBE Goal |
- Team: Thruway, NYSDOT & FHWA
- Design Build delivery, complex project
- Limited subcontracting opportunities
- Considered all DBE firms nationwide
|
FHWA Risk Assessment for the New NY Bridge DBE Program
FHWA's Approach to Position the New NY Bridge Project's DBE Program for Success.
| Description |
|
| Risk Statement |
- If project not properly administered
- If a proactive Plan is administered
|
| Response Activites |
- Appropriate goal, reviews, OIG involvement
- Summit, on-going forums, track success
|
Risk Ahead
FHWA DBE Program Risk Assessment Heat Diagram
- Example of Risk Assessment Approach Using "Heat Diagram"
- DBE Program Was Among the Key Factors Reviewed by FHWA
- Assessment influenced DBE global development

View a larger version of the heat diagrams
Mitigating Risk Through Collaboration
- Good Faith Efforts
- Commercially Useful Function
Defining
Determining Risk to Each Partner
Monitoring Plans
Finding Opportunities to Collaborate
Thruway Management Approach Compliance Programs
- DBE
- Labor Compliance
- Project Labor Agreement (PLA)
- EEO/AA
Thruway DBE Compliance
- The DBE Plan
- Commercially Useful Function
- Prompt Payment
- Good Faith Efforts
- Processing and Resolving Complaints
- Commitment and Attainment of the Goal
 Environment to Collaborate
- Additional management tools needed
- Stakeholders agree to collaborate
Results as follows...
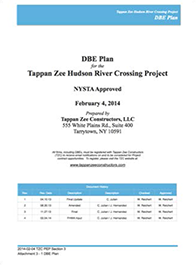
TZC DBE Plan
- TZC's Roadmap to meet DBE Goal
- Provides Specificity
- Defines On-Going Good Faith Efforts
TZC DBE Goal Management Plan
- Segments New NY Bridge Project into 17 "smaller" projects, aka DBE Plan Work Areas
The following items are tracked for each DBE Plan Work Area
- Overall Budget
- DBE Goal
- DBE Current Commitment
- DBE Pending Commitment
- DBE Commitments Remaining
- DBE Attainments
- #Firms Contracted

View larger TZC DBE Goal Management Plan table
Monthly Business Orientation Meeting

- On-going opportunity to meet with TZC team
- Saves time for businesses seeking opportunity
- Each meeting focused on specialty
Monthly E-Blast
- Project update emailed monthly
- Updates DBE Participation
- Lists recently awarded contracts
- 90 day procurement look ahead
- Links to project website
- Links to TZC questionnaire

By the Numbers:
Through July 31, 2014
177 trade contractors and professional service firms have performed on the New NY Bridge project site.
81 of the 177 firms are DBEs.
$85.8m is the total dollar value commitment to these DBE firms.
TZC Vendor Database
National Perspective
- 10,000 Firms
- 6,000 DBEs
- Includes every DBE from NY, CT, MA, MD, NJ & PA

View a larger version of the United States map showing DBEs
Management Tools: Work Breakdown Structure
- Visual aid showing contractual relationships and key information for each TZC team member

- Close up on calculation for project supplier with $161,419 contract for purchase and install of furniture.
- Removed $57,967 for use of non-DBE sub...self perform work is now
$103,452.
- Applied 60% credit to self perform work as it covered furniture purchase only.
- DBE credit is $62,071

Management Tools: DBE Participation Schedule

View larger version of the chart

View larger version of the DBE Forecasted Commitments chart
Contact Information
Tracey Mitchell
Diversity Compliance Manager
New York State Thruway Authority
Tracey.Mitchell@newnybridge.com
Christine Thorkildsen
Civil Rights Program Manager
FHWA - New York Division
Christine.Thorkildsen@dot.gov
Questions & Input
Submit a question using the chat box
Major Project Announcements
Project Delivery Team
Center for Innovative Finance Support
Financial Plan Updates
- Financial Plan Guidance
- Comment period in Federal Register closed on October 7, 2013
- Received 10 comments AASHTO, AK, AR, CO, Ernst and Young, NV, PE in CA Govt., CO, WA, WI
- Most comments were related to OINCC, phasing plans, P3 assessments, timing of submission, financing costs
- Financial Plan Guidance is currently being finalized
- Webinars will be scheduled to introduce guidance
P3 Training Course Availability
- The Center for Innovative Finance Support has developed a series of training sessions for interested state, regional, and local government officials
- Purpose: provide information and tools to government officials seeking to understand how to develop and evaluate potential P3 proposals
- Structure: FHWA-sponsored instructor presents in-person training tailored to address needs of requesting agency
- Type of Training: mix of presentations, class discussions, and hands-on computer training using P3-VALUE tools
- Length: as short as one-half to as long as 4 days
- Course Options: select among the following modules, depending upon your agency's needs
- P3 Evaluation Overview (1/2 day)
- Risk Assessment and Valuation (1 day)
- Value for Money Analysis (1 day)
- Financial Viability Analysis (1/2 day)
- P3 Evaluation Case-Study using P3-VALUE (1 day)
- Capacity: maximum class size of 40 students; no minimum
- Cost: Free; sponsoring agency needs to provide classroom and computers
- For more information: visit http://www.fhwa.dot.gov/ipd/p3/toolkit/ or http://our.dot.gov/office/fhwa.hq/ipd/lists/calendar/calendar.aspx, or contact Patrick DeCorla-Souza at 202-366-4076 or patrick.decorla-souza@dot.gov
Comments & Input
Submit a question using the chat box Or Dial *1 to ask your question by phone
Upcoming Webinars
Joint DOT/FHWA Major Project Webinar
Tuesday, May 5th 1:30 to 3:30pm EDT
Quarterly Major Project Webinar (FHWA)
Tuesday, February 3rd 1:30 to 3:30pm EST
Contact LaToya at latoya.johnson@dot.gov or 202-366-0479 if you have topic ideas for upcoming webinars
Contact Information
Jim Sinnette
Project Delivery Team Leader
Center for Innovative Finance Support
Federal Highway Administration
(202) 366-1561
James.Sinnette@dot.gov
Dana Williams
Outreach and Communications
Specialist
Center for Innovative Finance Support
Federal Highway Administration
(202) 366-1616
Dana.Williams@dot.gov


