There is broad interest in the United States in identifying key factors of community resilience and understanding where we stand as a Nation related to those factors so that we can develop better-informed capacity-building strategies. The Mitigation Framework Leadership Group (MitFLG) has developed a draft concept with potential indicators and measures of community resilience that may be considered by a variety of users when evaluating how to improve communities’ ability to prepare for, respond to, and recover from disasters. Information on the draft concept can be accessed from this page. The MitFLG encourages stakeholders to provide comments on this draft approach.
The Challenge
Defining and quantifying community resilience capacity can be challenging at any level; however, it is especially complicated on a national scale. While most actions to improve community resilience capacity occur at the local level, Federal programs provide numerous resources that support relevant community capacity building nationwide. It is important to understand how such actions improve local resilience capacity. However, Federal agencies also must gauge how their efforts individually and collectively impact community resilience capacity nationwide. The availability of locally scaled data for use in understanding and tracking community resilience capacity nationally is very limited. Federal agencies could improve availability significantly by using a consistent framework for community resilience indicators to help guide the development of useful measures, promote the identification and sharing of relevant data, and facilitate the collection of new data needed to fill critical information gaps.
Background
The Federal Emergency Management Agency (FEMA) and the National Oceanic and Atmospheric Administration (NOAA) initially undertook a joint project to explore resilience indicators and measures. The project then evolved into a broader interagency partnership under the Mitigation Framework Leadership Group. Leaders representing multiple Federal agencies have expressed interest in common indicators of community resilience to help inform and prioritize resilience policy, capacity-building strategies, and outcomes. Related needs identified by key public- and private-sector stakeholders also served as important drivers for this effort.
The interagency project team developed a Draft Concept Paper from a Federal perspective, identifying needs and opportunities using Federal resources to track community resilience capacity-building progress at a national scale. To broaden potential applicability, the team offers a conceptual framework in the Draft Concept Paper for the purpose of soliciting feedback from key public- and private-sector stakeholders and identifying possible connections to related efforts at multiple scales.
Key Components
The key components of the Draft Concept Paper are summarized below.
Community Resilience Primer
The Draft Concept Paper includes key definitions and concepts related to community resilience capacity. The paper helps set the stage for establishing some common, broadly applicable indicators across diverse Federal programs that contribute to community resilience capacity building in many different ways. These Federal capacity-building contributions include:
- Supporting intrinsic community functions that are also critical for absorbing, rebounding from, and adapting to hazard risks;
- Facilitating hazard-focused community preparedness, risk management, and mitigation actions that reduce long-term vulnerabilities; and
- Enabling post-disaster community recovery and redevelopment that integrates community resilience objectives.
National Preparedness Goal Alignment
The Draft Concept Paper provides a structured approach for aligning national-level community resilience indicators and building out a suite of relevant measures that align with the National Preparedness Goal. The top level of the structure consists of 10 core capabilities associated with the mitigation and recovery mission areas under the National Preparedness Goal:
- Housing
- Health and Social Services
- Economic Recovery
- Infrastructure Systems
- Natural and Cultural Resources
- Threats and Hazards Identification
- Risk and Disaster Resilience Assessment
- Planning
- Community Resilience
- Long-Term Vulnerability Reduction
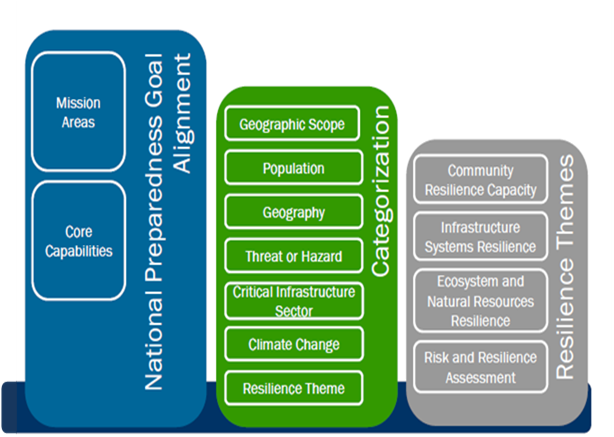
The Draft Concept Paper also describes the potential indicators and proposed measures using a recently developed taxonomy. The taxonomy was designed to provide greater precision to the universe of Federal community resilience resources in the context of the National Preparedness Goal. An overview of the taxonomy is provided in the graphic below. More detailed information is provided in the main body of the paper and in Appendix A.
Community Resilience Indicators
For the Draft Concept Paper, the term “indicators” refers to general conditions or factors associated with community resilience capacity. A number of community resilience indicators complement the 10 mitigation and recovery mission area core capabilities. Those indicators are grounded in scientific research literature and represented in notable community resilience assessment methodologies and applications. The indicators presented in the paper provide an initial template for possible use in further defining and building out relevant measures for community resilience capacity at multiple scales.
Proposed National-Level Measures
The Draft Concept Paper presents a number of proposed and future national-level measures associated with various indicators of community resilience capacity. These proposed measures are only a subset of the possible relevant options. They reflect project-driven time and resource limitations, including dependence on readily available Federal geospatial datasets with nationwide coverage at county (preferred) or State (minimum) levels. The main body of the paper provides a summary of the proposed measures; significantly more detail appears in Appendix B.
Data Access and Availability
Because the focus of this initial effort was on national-level indicators and measures, the project team generally aggregated community-scale data into State- and national-level summaries for analysis and presentation purposes. The team recognizes, however, that the greatest potential value for many stakeholders is in the availability of relevant Federal data for assessing community resilience capacity at local levels. Descriptions and links to the data used and created to support this effort appear in Appendix C of the Draft Concept Paper. For direct access, see the table under “Direct Access to Federal Datasets” below.
Web Mapping Application/Viewer
The Draft Concept Paper is supplemented by a Geographic Information System-based web mapping application and viewer that provides a visual representation of the data distribution for many of the proposed and future indicators and measures. The web mapping application/viewer also provides access to State- or county-specific report findings and to original agency datasets. The web mapping application/viewer is available online. A screenshot from the web mapping application is shown below. The project team encourages users to view and interact with project-related data using the web mapping application.
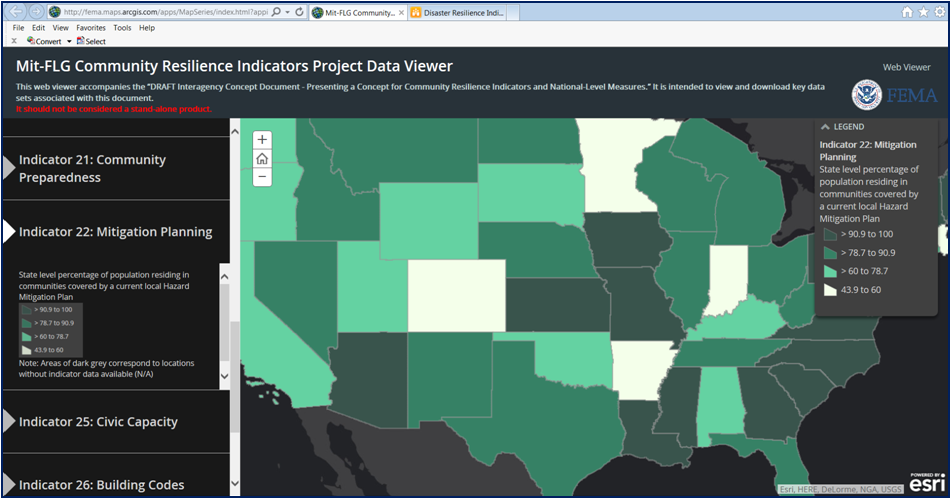
Web Application Components
The primary components of web mapping application are the indicator dataset navigation bar and the map body. The navigation bar provides access for each indicator with a proposed measure, as well as the ability to toggle between specific indicators to investigate the proposed measures geographically. The navigation bar also includes a legend and a link to a downloadable zip file containing a local version of the hosted dataset, the original source data (where they are publicly available), and the data disclaimer.
The map body visually displays the aggregated data for the selected measure. A muted dark gray canvas serves as the base map, and users have the ability to pan around and zoom in or zoom out, allowing them to investigate areas of interest further. Additionally, a user’s selection of a State or county enables a popup functionality that allows the user to view several key attributes and download data if desired.
Web Application Format
The web mapping application is a static product. A future operational goal could be to configure the application to allow Federal agencies to update their data contributions regularly, especially for tracking the progress of certain measures over time. For this to be successful, Federal agencies will need to publish datasets as industry-standard web services – that is, Representational State Transfer (REST) or Web Map Service (WMS) – that permit open access and download of the associated data. The long-term strategy is to encourage Federal agencies to publish data that are relevant to resilience assessment in easily accessible and usable formats that lend themselves to both statistical and geospatial analysis, thus making the data publicly available for use by communities, academics, and other agencies as a data.gov initiative.
Direct Access to Federal Datasets
The table below lists the publicly available Federal community-scale resources that were either (a) used as source data for proposed national-level measures or (b) identified as potentially relevant data for future development of additional national-level measures under the indicator framework.
Dataset and Access Link | Description | Relationship to Indicators and Proposed Measures |
|---|---|---|
HUD Comprehensive Housing Affordability Strategy (CHAS) Data | The Comprehensive Housing Affordability Strategy (CHAS) data, provided by the U.S. Department of Housing and Urban Development (HUD), offers a wide range of information about housing conditions. | Source data used for proposed measures of Housing Condition Indicator and Housing Affordability Indicator |
U.S. Department of Health and Human Services (HHS) AHRF provides a comprehensive set of data offering a broad range of health resources and information, including the number of primary care physicians and local population. | Source data used for proposed measure of Health Care Availability Indicator | |
The Centers for Disease Control and Prevention (CDC) collects data and trends of diagnosed diabetes, obesity, and leisure-time physical inactivity at the national, State, and county levels. Information includes (1) State- and county-level data in the U.S., (2) data on how counties compare with each other, and (3) maps and motion charts to examine how changes in diabetes coincide with changes in obesity over time and by location. | Source data used for proposed measure of Healthy Behaviors Indicator | |
The National Air Toxics Assessment (NATA), developed by the U.S. Environmental Protection Agency (EPA), provides modeled estimates of respiratory disease risk as the result of exposure to toxic air contaminants. | Potential data source for future measure of Environmental Health Indicator | |
Developed through an Economic Development Administration (EDA)-sponsored effort, the Innovation Index highlights factors that indicate a region is more or less ready to participate in the knowledge economy. The index provides regional-scale data that can help communities understand how they compare to the nation, other regions, and States in terms of innovation capacity and innovation results. | Potential data source for future measure of Economic Health/Sector Strength Indicator | |
U.S. Bureau of Labor Statistics (BLS) provides annual unemployment estimates for each county and State nationwide. Because unemployment data may have wide year-to-year variability, this BLS report provides 3-year unemployment rate averages. | Source data used for proposed measure of Employment Opportunity Indicator | |
U.S. Bureau of Economic Analysis (BEA) provides per capita local area personal income, which BEA calculates as the total personal income of the residents of a given area divided by the resident population of the area. BEA measures personal income before the deduction of personal income taxes and other personal taxes and reports it in current dollars. | Source data used for proposed measure of Income Indicator | |
The Intermodal Passenger Connectivity Database (IPCD), managed by the U.S. Bureau of Transportation Statistics (BTS), provides a national quantification of the degree of connectivity in the passenger transportation system. | Source data used for proposed measure of Transportation Connectivity Indicator | |
The Federal Transit Administration (FTA) provides national transit system data through the National Transit Database (NTD). U.S. Congress established the NTD to be the primary national source for transit system information and statistics. By statute, recipients or beneficiaries of certain grants from the FTA must submit data to the NTD. As part of the data submission, local transit authorities report on the number of total transit stations, as well as the number of transit stations that are ADA-compliant. | Source data used for proposed measure of Transit Accessibility Indicator | |
Water/Wastewater Agency Response Networks (WARNs) (Note: Data were provided by EPA partner organization, American Water Works Association) | EPA encourages States to establish WARNs to provide methods whereby water/wastewater utilities provide and receive emergency aid and assistance necessary due to sustained or anticipated damage from natural or human-caused incidents. | Source data used for proposed measure of Water Sector Emergency Support Indicator |
The National Telecommunications and Information Administration (NTIA) created the National Broadband Map (NBM) in collaboration with the Federal Communications Commission, and in partnership with 50 States, five Territories, and the District of Columbia. The NBM provides maps and downloadable data on broadband availability across every neighborhood in the United States. First published in February 2011, NTIA updated the NBM every 6 months through April 2015 with data from the State Broadband Initiative. NTIA currently collects broadband deployment data from service providers every 2 years. | Potential data source for future measure of Telecommunications Accessibility Indicator | |
The U.S. Army Corps of Engineers (USACE) maintains the National Inventory of Dams (NID) in close collaboration with FEMA and State regulatory offices. Dams in the NID must meet at least one of the following criteria; (1) High hazard classification - loss of one human life is likely if the dam fails, (2) Significant hazard classification - possible loss of human life and likely significant property or environmental destruction, (3) Equal or exceed 25 feet in height and exceed 15 acre-feet in storage, and (4) Equal or exceed 50 acre-feet storage and exceed 6 feet in height. | Potential data source for future measure of Dam Safety Indicator | |
The USACE-maintained National Levee Database (NLD) is a dynamic, searchable inventory of information about levees and a key resource supporting decisions and actions affecting levee safety. The NLD provides information about the location and condition of levees and floodwalls, as well as reports, inspection summaries, and other related records. The NLD includes detailed information about the levees in the National Levee Safety Program, as well as a growing library of available information on levees outside of the USACE program. | Potential data source for future measure of Dam Safety Indicator | |
The U.S. Geological Survey (USGS) tracks the estimated use of water nationwide, including the public supply deliveries for domestic use. USGS collects the data from counties every 5 years for the national water use report. | Source data used for proposed measure of Water Conservation Indicator | |
This EPA EnviroAtlas dataset represents the percentage of land area that is classified as forest land cover, modified forest land cover, and natural land cover in each subwatershed (12-digit Hydrologic Unit Classification, or HUC). (The EPA EnviroAtlas uses the National Land Cover Database for these data.) | Potential data source for future measures of Wetlands Conservation Indicator | |
The U.S. Forest Service (USFS) Forest Inventory and Analysis (FIA) Program provides the information needed to assess America's forests. The FIA Program reports on status and trends in forest area and location; in the species, size, and health of trees; in total tree growth, mortality, and removals by harvest; in wood production and utilization rates by various products; and in forest land ownership. | Potential data source for future measures of Forest Conservation Indicator | |
This EPA EnviroAtlas dataset illustrates the percent of land within a subwatershed (12-digit HUC) that has legally recognized easements for conservation or other protections in place to restrict human use or development. These data include both public and private land. (The EPA EnviroAtlas uses the Protected Areas Database of the United States for these data.) | Potential data source for future measures of Wetlands Conservation and Forest Conservation Indicators | |
In support of the National Fish Habitat Partnership (NFHP), the USGS works with partners and stakeholders to gather data in support of conducting a condition assessment of fluvial water bodies throughout the U.S.). The dataset is available to NFHP participants and other users interested in acquiring consistently organized information characterizing river systems over larger regions. | Potential data source for future measure of Habitat Quality Indicator | |
Percent Stream Buffer Zone As Natural Land Cover for the Conterminous United States | This EPA EnviroAtlas dataset shows the percentage of land area within a 30‑meter buffer zone along the National Hydrography Dataset high-resolution stream network, and along water bodies (such as lakes and ponds) that are connected via flow to the streams, that is classified as forest land cover, modified forest land cover, and natural land cover using the NLCD for each Watershed Boundary Dataset 12-digit HUC in the conterminous U.S. | Potential data source for future measure of Habitat Quality Indicator |
The National Weather Service provides data about StormReady® and TsunamiReady® sites, ranging in geographic scale from States to counties, to specific commercial and educational sites. | Source data used for proposed measure of Community Preparedness Indicator | |
FEMA requires State, Tribal, and local governments to develop and adopt hazard mitigation plans as a condition for receiving certain types of non-emergency disaster assistance, including funding for mitigation projects. Jurisdictions must update their hazard mitigation plans and re-submit them for FEMA approval every 5 years to maintain eligibility. The data provided indicate the status of hazard mitigation plans in local jurisdictions across the nation. | Source data used for proposed measure of Hazard Mitigation Planning Indicator | |
Corporation for National and Community Service (CNCS) Volunteering and Civic Life in America | The CNCS site provides a comprehensive look at volunteering and civic life in the 50 States and 51 cities across the U.S. Data include volunteer rates and rankings, civic engagement trends, and analysis. | Source data used for proposed measure of Civic Capacity Indicator |
ISO Building Codes Effectiveness Grading Schedule (BCEGS) (Note: ISO developed the community- level BCEGS data. The link above is for aggregated State-level data, which were used by permission from ISO. Users may obtain community-specific BCEGS data directly from ISO.) | The Insurance Services Office (ISO) BCEGS® program assesses the building codes in effect in a particular community and how the community enforces them, with special emphasis on mitigating losses from natural hazards. ISO assigns each municipality a Building Code Effectiveness Classification from 1 (exemplary commitment to building-code enforcement) to 10 for both commercial and residential construction. | Source data used for proposed measure of Building Codes Indicator |
The Community Rating System (CRS) is a voluntary incentive program through which FEMA recognizes and encourages community floodplain management activities that exceed the minimum NFIP requirements. The data provided are from the most recent Flood Insurance Agent's Manual containing current and historical listings of all CRS communities, their class, and insurance discount. | Source data used for proposed measure of Higher Standards Indicator | |
View/Download the Draft Concept Paper
The Draft Concept Paper is available for viewing or download from the FEMA Library.
Stakeholder Feedback Encouraged
The initial target audiences for the Draft Concept Paper and the companion web mapping application/viewer are Federal agency programs contributing to community resilience capacity building and their primary public- and private-sector partners. Other potential end users of this report are:
- Local, State, Tribal, Territory, and insular area governments with an interest in understanding and improving their community resilience capacity;
- Academic and nongovernmental organizations with an interest in resilience measurement; and
- Key private-sector practitioners, such as insurers and builders, who are attuned to governmental efforts to promote disaster risk reduction.
Please send comments on the Draft Concept Paper or web mapping application/viewer via email to FEMA-communityresilience@fema.dhs.gov.