air research

Taking Air Sensors to Communities

By Joel Creswell

When I read about air quality in the news, it’s often described as a large scale problem where entire cities or states are being affected. While it’s important to think about these problems on a larger scale, I often wonder more about what’s happening in my neighborhood. Does the air I breathe while walking my dog down a busy street affect my health? What about if there is construction on my block or an industrial facility down the road? After all, what I really want to know about is what I’m being exposed to–something that information about regional air quality doesn’t fully capture.

Air Sensor with Briefcase that says citizen science toolbox EPA has a team of people working to make low-cost tools for community and personal air pollution monitoring more accessible. They have produced a multitude of resources to help people find the right tool to use and to make sure they’re using it correctly. These include the Air Sensor Toolbox for Citizen Scientists, air sensor performance evaluations, and a set of curriculum materials for teachers on air quality and climate change. EPA also recently awarded six community air monitoring grants to organizations around the country addressing the challenges of using low-cost tools to monitor local air quality.

two people learning about air sensors

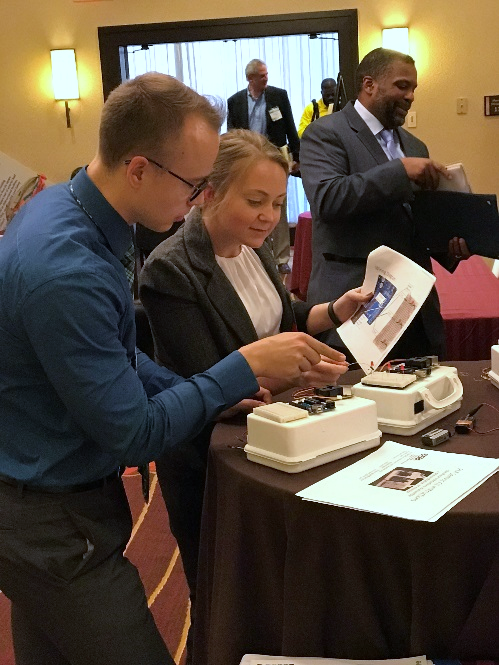
Demonstrating air sensors at the 2016 Summit to Revitalize Vulnerable Communities.

Aside from grant funding, one of the best ways we can help individuals understand their exposure to air pollution is to meet with community leaders and help them address their air quality monitoring needs. I had just such an opportunity recently, when I attended the 2016 Summit to Revitalize Vulnerable Communities. My colleague Dan Bator, an Environmental Health Fellow for the Association of Schools and Programs of Public Health, and I demonstrated two low-cost monitoring technologies for airborne fine particulate matter. One was an air sensor for educational purposes only (pictured) that you can build yourself using these simple instructions and parts you can buy online. The other was the AirBeam, an off-the-shelf device developed by the non-profit group HabitatMap. Over the course of an evening, Dan and I spoke to numerous community leaders about how low-cost air sensors work and how they can measure air quality in communities and provide data to address environmental justice issues.

The problems described by community leaders varied. One was worried about the volume of traffic from a nearby port while children are going to and from school. One was concerned about industrial facilities. Another was interested in the impacts of a highway in her community. All were excited to learn that there were tools they could use to conduct their own air quality monitoring. These low-cost air quality monitors are not as accurate as the high-precision instruments used for regional and national monitoring, but the ability to monitor air quality at the local level empowers communities to address their concerns with real data.

Measuring my own air quality is important to me too. I built a particulate matter sensor using the instructions above. I’ve used it to measure the air inside my house and on my block. This gives me an idea of when pollution around me is high and when I should think about reducing my exposure, such as avoiding strenuous exercise outdoors. To help me understand my sensor readings and what actions to take, EPA has launched a pilot project to develop a scale for air sensors that provide data in short time increments. I also check the regional air quality forecast on AirNow.gov. Both can help me protect my health.

About the author: Joel Creswell is an environmental chemist and a AAAS Fellow on the EPA Office of Research and Development’s Innovation Team. Prior to coming to EPA, he worked on developing environmental trace metals analyzers for a scientific instrument company.

Editor's Note: The opinions expressed herein are those of the author alone. EPA does not verify the accuracy or science of the contents of the blog, nor does EPA endorse the opinions or positions expressed. You may share this post. However, please do not change the title or the content. If you do make changes, please do not attribute the edited title or content to EPA or the author.

EPA's official web site is www.epa.gov. Some links on this page may redirect users from the EPA website to a non-EPA, third-party site. In doing so, EPA is directing you only to the specific content referenced at the time of publication, not to any other content that may appear on the same webpage or elsewhere on the third-party site, or be added at a later date.

EPA is providing this link for informational purposes only. EPA cannot attest to the accuracy of non-EPA information provided by any third-party sites or any other linked site. EPA does not endorse any non-government websites, companies, internet applications or any policies or information expressed therein.

EPA Brings a Low-Cost Air Sensor Network to Memphis

By Michaela Burns

air sensors on top of building overlooking memphis

Sensors installed at the Memphis Area Transit Authority facilities.

Outdoor air quality can vary from neighborhood to neighborhood within the same city. All sorts of things can contribute to this variation, including traffic patterns, local industry, and even the way air moves between buildings.

Communities are increasingly interested in learning more about what pollutants are in the air.  Knowing about the air quality in your community can help you decide what actions to take to protect your health. That is where new air sensors come into play. They are low-cost, highly portable, and offer new ways to measure air quality in and around a community.

However, this new monitoring technology may not be as precise as more traditional technology used by state and federal governments for regulation. How can scientists use data from these sensors, even if they are not as accurate as traditional models?

To help answer this question, EPA is collaborating with the Shelby County Health Department and the Memphis Area Transit Authority to conduct the CitySpace Air Sensor Network project. EPA researchers will install and field test a city-wide-network of low-cost sensors to measure air pollution across the greater Memphis area, which includes counties in Tennessee, Arkansas, and Mississippi.

The goal of the CitySpace project is to examine the value of using a low-cost air sensor network to estimate the distribution of local air quality conditions and how emerging technologies perform in this type of research.

In October and November, researchers installed air sensor pods at locations in the greater Memphis area based on the input of local communities and other local stakeholders.  Sensors are located in neighborhoods, industrial areas, and rural settings. The sensors use emerging technologies that allow environmental data to be measured and instantaneously streamed to a secure EPA website.

All of these sensors will collect data on particulate matter (PM), a common air pollutant, and meteorological conditions such as temperature, humidity, and wind patterns.

Want to know one of the best parts of the study? A majority of the air sensors are 100 percent solar powered and self-sustainable.  They won’t require a lot inspection or maintenance, so scientists can focus on reviewing the data.

Hopefully, the work won’t stop in the Memphis metropolitan area. The success of this study could encourage other cities to use low-cost air sensor networks in evaluating local pollution.  Through air research efforts like this, EPA is helping to fulfill its mission to protect air quality.

Learn more about the City Space project:

Read the press release.

Read our factsheet on the CitySpace project.

About the Author: Michaela Burns is an Oak Ridge Associated Universities contractor and writer for the science communication team in EPA’s Office of Research and Development.

Editor's Note: The opinions expressed herein are those of the author alone. EPA does not verify the accuracy or science of the contents of the blog, nor does EPA endorse the opinions or positions expressed. You may share this post. However, please do not change the title or the content. If you do make changes, please do not attribute the edited title or content to EPA or the author.

EPA's official web site is www.epa.gov. Some links on this page may redirect users from the EPA website to a non-EPA, third-party site. In doing so, EPA is directing you only to the specific content referenced at the time of publication, not to any other content that may appear on the same webpage or elsewhere on the third-party site, or be added at a later date.

EPA is providing this link for informational purposes only. EPA cannot attest to the accuracy of non-EPA information provided by any third-party sites or any other linked site. EPA does not endorse any non-government websites, companies, internet applications or any policies or information expressed therein.

Pathfinder Innovation Project—Using Zebrafish to Quickly Screen Air Pollution Sources for Potential Impact on Heart Health

By Aimen Farraj

Fine particulate matter (PM)—a tiny mass of solid and liquid matter floating in the air—comes from sources that emit air pollution including automobiles, power plants and forest fires, and is also formed by the interaction of other air pollutants.  PM is everywhere and exposure levels are largely determined by how close one is to an emitting air pollution source.

Many studies have shown that PM’s health effects stem largely from its impact on the heart, driving people to the hospital and making diseases like heart failure worse.  These health effects are caused by chemicals within particulate matter, which vary depending on the air pollution source.  No two air sheds are alike, resulting in endless numbers of unique PM samples with little information on their potential to affect health. Traditional methods for assessment are just too slow and impractical.

In 2013, our team applied for a Pathfinder Innovation Project (PIP) to develop an approach to rapidly assess the cardiotoxicity potential of PM from different sources. The PIP program is an internal competition for EPA scientists to receive time to explore their biggest ideas in environmental research. The goal of this work is to identify PM sources and PM components that cause cardiovascular effects on a larger scale to expedite risk determinations associated with exposure to different air sheds.

an illustration of a zebrafish

Two day-old wild type zebrafish used for heart rate determinations

To do this, we developed a zebrafish model to assess cardiotoxicity of PM from different sources.  Zebrafish are tropical freshwater fish that have uncanny similarities in cardiac function with humans and their small size makes them ideal for rapid testing.  The zebrafish model we developed is based on measurement of a simple health metric, i.e. heart rate, in hundreds of fish in a 96-well plate. Since the early days of the project, we have demonstrated that this model can be used to quickly assess cardiac impacts of PM exposure.

Now the team is working to refine all aspects of the model, including increased automation to permit rapid heart rate determinations and to expand the number of PM sources assessed.  If successful, this effort may accelerate the pace at which PM toxicity information is acquired, link health effects to specific air pollution sources, and inform strategies to target and reduce PM sources linked to highest potency components.


Pathfinder Innovation Project Team: Aimen Farraj, Stephanie Padilla, Alan Tennant, Rory Conolly, David DeMarini, Ian Gilmour, Mike Hays, Najwa Haykal-Coates, Wayne Cascio, Mehdi Hazari, and Oak Ridge Institute for Science and Education student Kyle Martin


About the Author: Dr. Aimen K. Farraj is in his eleventh year as EPA’s Principal Investigator in the Environmental Public Health Division.  His research interests include the study of the adverse cardiovascular effects of air pollution and development of better predictive tools for risk assessment.

Editor's Note: The opinions expressed herein are those of the author alone. EPA does not verify the accuracy or science of the contents of the blog, nor does EPA endorse the opinions or positions expressed. You may share this post. However, please do not change the title or the content. If you do make changes, please do not attribute the edited title or content to EPA or the author.

EPA's official web site is www.epa.gov. Some links on this page may redirect users from the EPA website to a non-EPA, third-party site. In doing so, EPA is directing you only to the specific content referenced at the time of publication, not to any other content that may appear on the same webpage or elsewhere on the third-party site, or be added at a later date.

EPA is providing this link for informational purposes only. EPA cannot attest to the accuracy of non-EPA information provided by any third-party sites or any other linked site. EPA does not endorse any non-government websites, companies, internet applications or any policies or information expressed therein.

DIY Air Monitoring: Check Out the Online Air Sensor Toolbox First

By Ann Brown

airsensoridEPA’s online Air Sensor Toolbox puts air measurement capabilities into the hands of citizen scientists. We recently updated the Toolbox with additional information and a new look for even easier navigation.

The latest version of the Toolbox provides a variety of resources on using air sensor technologies, including new sensor performance reference tables. One of the most popular resources is the Air Sensor Guidebook, a how-to for using of air sensors and what to consider before getting started with a citizen science project. In addition, the Toolbox includes scientific reports on air sensor monitors that undergo testing and evaluation by EPA. Technical documents on operating procedures also are available.

Want to know what your monitor readings mean? The Toolbox also offers some guidance on how to interpret one-minute readings from air sensors. EPA has launched a pilot project to test a “sensor scale” for two main air pollutants–ozone and particle pollution, also known as particulate matter. The pilot is designed to help people understand what the real-time data generated by these monitors means for air quality and what to consider when planning outdoor activities.

EPA supports the advancement of sensor technologies to help citizens assess local air quality and alert them to potential concerns. The gold standard system in monitoring capability, however, is EPA’s national monitoring network. These monitors are stationary and have undergone rigorous testing for their accuracy and reliability. The data from these monitors are used by EPA, states and others to implement the nation’s air quality standards. Portable air sensors, on the other hand, are still being tested for their reliability, but are being used to examine local air quality conditions and help promote environmental awareness activities

Before you jump into an air sensor monitoring project, it is good to do your homework. The Toolbox has resources to help make decisions on what and where to monitor, what sensors to use and how to evaluate data using a free RETIGO mapping tool developed by EPA.

Plan to spend a little money to purchase one or more air sensors or find a partner with resources:  sensors can cost a couple hundred dollars or more. And finally, you can get your daily air quality forecast and current air quality information for your area on the AirNow.gov website.

Visit the Toolbox

Learn about local air quality


About the author: Ann Brown is the communications lead for EPA’s Air, Climate, and Energy Research Program.

Editor's Note: The opinions expressed herein are those of the author alone. EPA does not verify the accuracy or science of the contents of the blog, nor does EPA endorse the opinions or positions expressed. You may share this post. However, please do not change the title or the content. If you do make changes, please do not attribute the edited title or content to EPA or the author.

EPA's official web site is www.epa.gov. Some links on this page may redirect users from the EPA website to a non-EPA, third-party site. In doing so, EPA is directing you only to the specific content referenced at the time of publication, not to any other content that may appear on the same webpage or elsewhere on the third-party site, or be added at a later date.

EPA is providing this link for informational purposes only. EPA cannot attest to the accuracy of non-EPA information provided by any third-party sites or any other linked site. EPA does not endorse any non-government websites, companies, internet applications or any policies or information expressed therein.

Air Sensors in Puerto Rico: Empowering a Community with Scientific Knowledge

By Christina Burchette

Drop a stone in a placid lake and you’ll notice that the impact of stone hitting water creates a ripple effect that spreads outward in gentle, incremental waves. It is a quiet but powerful image of something we all know to be true: a small act can generate great significance over time.

EPA researchers Ron Williams and Maribel Colón hope to start a ripple effect in Tallaboa-Encarnación, a small community that sits along the Southern Coast of Puerto Rico. Williams, Colón, and EPA’s Caribbean Environmental Protection Division will work with local community action group DISUR (Desarrollo Integral del Sur) to install and maintain low-cost air monitoring devices in Tallaboa-Encarnación. These devices  will help community members analyze local pollutant levels and better understand the local environmental conditions.

aerial view of the community

The Tallaboa/Encarnación community in Peñuelas, Puerto Rico was selected for this project and has an interest in collecting environmental data to support environmental awareness.

Researchers are currently building the community’s air monitors in EPA’s Research Triangle Park laboratory. The rectangular devices are about ten inches wide and will collect data on two common air pollutants: total volatile organic compounds (tVOC), which come from sources like vehicle exhaust, and fine particle pollution (PM2.5), which is emitted from motor vehicles, smokestacks, forest fires, and other sources that involve burning.

Once the devices are installed in the area, which is near a highway and several industrial facilities, community members and members of DISUR will participate in a day-long training using EPA’s Air Sensor Toolbox for Citizen Scientists to learn how to use the devices to collect, validate, and summarize environmental data.

Now more than ever, lower-cost air sensors are making air pollution monitoring citizen-accessible. People all over the world are collecting and analyzing local data to better understand air pollution in their communities and to make choices to protect their health. Our researchers’ involvement in the Tallaboa-Encarnación community project is especially important because the community would not have otherwise had access to these types of air monitoring tools and resources.

The small act of installing air monitoring sensors in such a remote community is about more than new air quality data. A community being able to take the fate of their health and environment into their own hands through scientific discovery is an amazing achievement—one that could create significant ripples in the pond of citizen science.

Learn more about this project by viewing our citizen science air monitoring in Puerto Rico fact sheet.

About the Author: Christina Burchette is an Oak Ridge Associated Universities contractor and writer for the science communication team in EPA’s Office of Research and Development.

Editor's Note: The opinions expressed herein are those of the author alone. EPA does not verify the accuracy or science of the contents of the blog, nor does EPA endorse the opinions or positions expressed. You may share this post. However, please do not change the title or the content. If you do make changes, please do not attribute the edited title or content to EPA or the author.

EPA's official web site is www.epa.gov. Some links on this page may redirect users from the EPA website to a non-EPA, third-party site. In doing so, EPA is directing you only to the specific content referenced at the time of publication, not to any other content that may appear on the same webpage or elsewhere on the third-party site, or be added at a later date.

EPA is providing this link for informational purposes only. EPA cannot attest to the accuracy of non-EPA information provided by any third-party sites or any other linked site. EPA does not endorse any non-government websites, companies, internet applications or any policies or information expressed therein.

Bubbling Up: Methane from Reservoirs Presents Climate Change Challenge

By Rose Keane

EPA researcher Jake Beaulieu spends a lot of his time on the water, especially at Harsha Lake, a reservoir just southeast of Cincinnati, OH. He’s not a sailor, nor does he work with marine life. Instead, Beaulieu studies how methane (CH4)—a less discussed but more powerful greenhouse gas than carbon dioxide—is emitted from reservoirs. He and other EPA researchers are developing new models and tools to improve methane emission estimates in reservoirs and our understanding of their contributions to greenhouse gas levels globally.

Beaulieu’s team using a new surveying technique to measure methane emissions from reservoirs.

Beaulieu’s team is applying surveying techniques in novel ways to estimate methane emissions.

Methane gas contributes to rising temperatures and one way it is produced is by tiny organisms in sediments at the bottom of lakes. One important source of food for these organisms is decaying algae, which is converted to methane when eaten by these tiny organisms.

According to Beaulieu, the way that methane emission rates from reservoirs are currently estimated doesn’t take into account a number of factors that can affect how much is emitted into the atmosphere such as the location, water depth, overall size of the reservoir and other conditions.

One of the main ways that large amounts of methane are released from reservoirs is through something called ebullition—or more simply, the bubbles that come up from the mud. The bubbles are filled with methane, and Beaulieu’s research has shown that in areas where the water is deeper and less disturbed, there’s less of these methane bubbles coming to the surface. In areas where the water is more shallow or more frequently disturbed, there’s not enough weight (from the atmosphere or from the water itself) to hold the bubbles in, so emissions increase.

In April this year, 177 countries and states across the world signed the Paris Agreement on Climate Change—a landmark agreement that outlines ways for countries to limit their greenhouse gas emissions, encourage more sustainable infrastructure and economic development, and better plan for responding to the impacts of changing climatic conditions. Beaulieu says that improved estimates of methane emissions from reservoirs will result in better information that can aid in the global effort to reduce greenhouse gas emissions.

His paper, Estimates of reservoir methane emissions based on a spatially balanced probabilistic survey, was recently published in Limnology and Oceanography.

About the Author: Rose Keane is an Oak Ridge Associated Universities contractor with the science communications team in EPA’s Office of Research and Development.

Editor's Note: The opinions expressed herein are those of the author alone. EPA does not verify the accuracy or science of the contents of the blog, nor does EPA endorse the opinions or positions expressed. You may share this post. However, please do not change the title or the content. If you do make changes, please do not attribute the edited title or content to EPA or the author.

EPA's official web site is www.epa.gov. Some links on this page may redirect users from the EPA website to a non-EPA, third-party site. In doing so, EPA is directing you only to the specific content referenced at the time of publication, not to any other content that may appear on the same webpage or elsewhere on the third-party site, or be added at a later date.

EPA is providing this link for informational purposes only. EPA cannot attest to the accuracy of non-EPA information provided by any third-party sites or any other linked site. EPA does not endorse any non-government websites, companies, internet applications or any policies or information expressed therein.

Climate Change…By the Seashore

By Andy Miller, Ph.D.

As the summer winds down, many of us return to school or work with fond memories of trips to the seashore. For me and for many others, where the ocean meets the land are places that are deeply relaxing, reminders of our connections with the natural world.

Cordgrass growing across Great Marsh, Jamestown, RI.

Cordgrass growing across Great Marsh, Jamestown, RI.

For several EPA researchers, the shores and estuaries that we value for their beauty and wonder are the sites for investigating the rich and complex ecosystems that support a multitude of species and provide us with benefits well beyond a calming walk along the shore.

Researchers have recently published results of work examining how different impacts of climate change are affecting coastal ecosystems. They demonstrate how vulnerable these natural resources are to drought, sea level rise, and other impacts of a changing climate.

Several studies looked at how the effects of climate change affected cordgrass, dominant salt marsh plants that are key to the vitality of salt marsh ecosystems in southern New England coastal wetlands. One study looked at how saltmeadow cordgrass, Spartina patens, responded to drought and sea level rise in a greenhouse set up for research. This study found that sea level rise was a threat to the long-term survival of the species. The loss of saltmeadow cordgrass would reduce the wetlands’ habitat quality, plant diversity, carbon sequestration, erosion resistance and coastal protection.

A second study examined smooth cordgrass, Spartina alterniflora, under similar stresses, and also added an additional stressor, increased levels of nitrogen in the water, an environmental pollutant resulting from agricultural runoff, urban stormwater runoff, wastewater from sewers and septic systems and other sources. EPA researchers Alana Hanson and her colleagues simulated all these plant stressors in the same research greenhouse and concluded that the effects of climate change and nitrogen runoff were likely to reduce the sustainability of salt marshes because the conditions made it more difficult for cordgrass to flourish. Without cordgrass, Atlantic coastal ecosystems would be as vulnerable as a sea turtle without its shell.

On the other side of the country, researchers on the Pacific coast have been developing an approach to evaluate how climate change is affecting coastal biodiversity. Working with experts from several federal, state, and local agencies, EPA researcher Henry Lee and his colleagues developed an approach to use environmental tolerances and other scientific information to estimate how groups of species can be expected to respond to changes in ocean temperature and acidity. Their tool, the Coastal Biodiversity Risk Assessment Tool, or CBRAT, provides an open-source platform that allows researchers and resource managers to examine the potential vulnerability of coastal Pacific fish and invertebrate species as they are impacted by climate change.

These research efforts help us understand more than just the impacts of climate change on coastal ecosystems—they also help us understand how we can respond to those changes in ways that will help protect them. Francis Bacon is credited with the saying, “The best part of beauty is that which no picture can express.” Although we see the natural beauty of our coasts and shores, the best part of that beauty may well be the unseen ways in which they nurture and support nature as a whole.

About the Author: Andy Miller is the Associate Director for Climate in EPA’s Air, Climate, and Energy Research Program that conducts research to assess the impacts of a changing climate and develop the scientific information and tools to act on climate change.

References

Hanson, A., R. Johnson, C. Wigand, A. Oczkowski, E. Davey and E. Markham (2016). “Responses of Spartina alterniflora to Multiple Stressors: Changing Precipitation Patterns, Accelerated Sea Level Rise, and Nutrient Enrichment.” Estuaries and Coasts: 39: 1376–1385.

Watson, E. B., K. Szura, C. Wigand, K. B. Raposa, K. Blount and M. Cencer (2016). “Sea level rise, drought and the decline of Spartina patens in New England marshes.” Biological Conservation 196: 173-181.

Lee II, H., Marko, K., Hanshumaker, M., Folger, C., and Graham, R. 2015. User’s Guide & Metadata to Coastal Biodiversity Risk Analysis Tool (CBRAT): Framework for the Systemization of Life History and Biogeographic Information. EPA Report. EPA/601/B-15/001. 123 pages.

Editor's Note: The opinions expressed herein are those of the author alone. EPA does not verify the accuracy or science of the contents of the blog, nor does EPA endorse the opinions or positions expressed. You may share this post. However, please do not change the title or the content. If you do make changes, please do not attribute the edited title or content to EPA or the author.

EPA's official web site is www.epa.gov. Some links on this page may redirect users from the EPA website to a non-EPA, third-party site. In doing so, EPA is directing you only to the specific content referenced at the time of publication, not to any other content that may appear on the same webpage or elsewhere on the third-party site, or be added at a later date.

EPA is providing this link for informational purposes only. EPA cannot attest to the accuracy of non-EPA information provided by any third-party sites or any other linked site. EPA does not endorse any non-government websites, companies, internet applications or any policies or information expressed therein.

From Grasslands to Forests, Nitrogen Impacts all Ecosystems

By Ashley Mayrianne Jones

Can there be too much of a good thing?

That’s the case with nitrogen, an essential element for plant growth that, in overabundance, can also be potentially damaging. Nitrogen moves from the air to the land, soil, and water via a process called nitrogen deposition. Atmospheric nitrogen deposition has increased ten-fold or more since pre-industrial levels due to increased emissions from the burning of fossil fuels, fertilizer use, and other human activities.

Blue Ridge Mountains at the Roan Highlands State Park in North CarolinaOnce nitrogen is emitted into the atmosphere, it can travel vast distances and deposit in the environment, making it a national as well as local problem. Elevated nitrogen deposition can increase leaf biomass in the canopy, shading ground-dwelling plants from the sun. Additionally, physical and chemical reactions that occur when nitrogen compounds are deposited can lead to more acidic soils. Both effects restrict plant growth and increase competition for limited resources, resulting in a loss of local biodiversity.

To date, most U.S. biodiversity studies on the effects of nitrogen deposition had been focused on individual sites, where fertilizer was applied and small plots were monitored through time. It was unknown whether the resulting reductions in plant biodiversity at these small scales translated to meaningful changes at the landscape level. A series of recent studies had indicated that across the European continent, many ecosystems were experiencing reductions in plant biodiversity due to nitrogen deposition. However, it remained unclear whether the same held true in the U.S., which historically, has experienced lower atmospheric deposition levels.

That’s why EPA researcher Chris Clark and a team of scientists from EPA, U.S. Geological Survey, the U.S. Forest Service, the University of Colorado, and multiple other universities are exploring the effects of nitrogen deposition on herbaceous plants (those with non-woody stems such as grass) in a first-of-its-kind study focused on multiple ecosystems across the nation. The new research expands the focus to not only grasslands, but into habitats that have not received much attention, including the forest understory.

The study, recently published in Proceedings of the National Academy of Sciences, assesses how nitrogen deposition affects herbaceous plants at over 15,000 forest, woodland, shrubland, and grassland sites throughout the United States. The research addresses how physical, chemical, and climatic factors such as soil acidity, temperature, and precipitation can affect an area’s vulnerability to nitrogen deposition.

Nearly a quarter of the sites were vulnerable to nitrogen deposition-induced species loss, and those with acidic soils tended to be more vulnerable. At extremely low levels of nitrogen deposition, the number of individual plant species tended to increase. However, above a certain threshold level, or “critical load,” diversity began to decline.

The study indicated that on average, forests can tolerate slightly higher levels of nitrogen deposition than other ecosystems before showing a negative impact on biodiversity. The reasons for this are unclear, but scientists hypothesize part of the reason is that forest species living under the canopy are already adapted to low-light conditions and are less susceptible to shading effects caused by increased nitrogen. Both grasslands and forests, however, were quite vulnerable to nitrogen deposition, with critical loads in the range of current deposition levels.

Moving forward, EPA scientists and their partners will attempt to determine which individual plant species are most at risk, and which native and invasive species may increase with elevated nitrogen deposition.

Examining multiple ecosystems across the country gives us more information about how different locations may respond to the effects of nitrogen deposition and will help set monitoring and conservation priorities that protect plant biodiversity.

Learn more about EPA’s Air, Climate, and Energy Research.

About the Author: Ashley Mayrianne Jones is a student contractor and writer working with the science communication team in EPA’s Office of Research and Development.

Citation: Biological Sciences – Ecology: Samuel M. Simkin, Edith B. Allen, William D. Bowman, Christopher M. Clark, Jayne Belnap, Matthew L. Brooks, Brian S. Cade, Scott L. Collins, Linda H. Geiser, Frank S. Gilliam, Sarah E. Jovan, Linda H. Pardo, Bethany K. Schulz, Carly J. Stevens, Katharine N. Suding, Heather L. Throop, and Donald M. Waller. Conditional vulnerability of plant diversity to atmospheric nitrogen deposition across the United States. PNAS 2016 113 (15) 4086-4091; published ahead of print March 28, 2016, doi:10.1073/pnas.1515241113

Editor's Note: The opinions expressed herein are those of the author alone. EPA does not verify the accuracy or science of the contents of the blog, nor does EPA endorse the opinions or positions expressed. You may share this post. However, please do not change the title or the content. If you do make changes, please do not attribute the edited title or content to EPA or the author.

EPA's official web site is www.epa.gov. Some links on this page may redirect users from the EPA website to a non-EPA, third-party site. In doing so, EPA is directing you only to the specific content referenced at the time of publication, not to any other content that may appear on the same webpage or elsewhere on the third-party site, or be added at a later date.

EPA is providing this link for informational purposes only. EPA cannot attest to the accuracy of non-EPA information provided by any third-party sites or any other linked site. EPA does not endorse any non-government websites, companies, internet applications or any policies or information expressed therein.

Collaborating with Local Communities to Measure Air Pollution

By Michaela Burns

I am no stranger to air pollution. Since I grew up in New York City, my walk to school every morning put me in constant contact with car exhaust and smoke rising from the vendor stations that lined the sidewalks. None of these experiences ever struck me as odd. They were just a part of the city’s charm! We had the Empire State Building, the Statue of Liberty, and we had air pollution. On particularly smoggy days, when I could barely see the city from my window, I always comforted myself with the fact that it was a problem far out of my league. After all, I was just an ordinary kid, not a scientist — what could I do to help? Nothing of course.

Once I started working at EPA, I found out that I had been completely wrong. Managing air pollution is a big job, but it can be made easier when the whole community gets involved. We call it “citizen science” — where people without a background in research can use scientific tools to address problems in their environment. To support this fast-growing field, EPA’s Science to Achieve Results (STAR) program is funding six grants to evaluate how effective low-cost, portable air sensors are when used in communities.

APM4C Blog Picture

EPA researcher Eben Thoma adjusts an SPod monitor.

EPA grant winners at the Massachusetts Institute of Technology will use community-based air sensors to measure air quality and volcanic smog (“vog”) exposure on the Island of Hawai‘i (“the Big Island”). Up the coast at the University of Washington, researchers plan to deploy air sensors in student-directed studies examining heavy wood smoke impacts in their rural community. The team will work in partnership with Heritage University, whose students represent the local population of predominantly Yakama Nation and Latino immigrant families, to identify effective ways to communicate pollutant results to a broader audience. And this is just a sample of the diverse group of projects being done to help make air sensors more available to the public across the U.S. Other efforts include:

Carnegie Mellon University. Researchers will investigate the accuracy and reliability of existing air sensors, as well as their efficacy when put to use in Pittsburgh communities.

Kansas State University. Researchers will investigate if communities in South Chicago become more engaged in learning about their environment if they are provided with low-cost air sensors and the information generated by them.

Research Triangle Institute This research team will investigate how low-cost sensors can be used to help the Globeville, Elyria, Swansea (GES) community north of Denver, Colorado measure and understand data indicating the air quality in their neighborhood. The team will also evaluate the effectiveness of how information is presented to enable residents to understand their exposure to indoor and outdoor air pollutants and potentially empower them to take action to protect their health.

South Coast Air Quality Management District. This research team will provide local California communities with the knowledge necessary to select, use, and maintain low-cost, commercially available air monitoring sensors and to correctly interpret sensor data. The group will communicate the lessons learned to the public through a series of outreach activities.

By supporting the development and deployment of air monitoring technology, EPA is empowering ordinary citizens to take action against air pollution. Looking out for your community can be as easy as using our air sensor toolbox for citizen scientists to find out how to monitor the air quality in your neighborhood. With tools in reach, there’s no reason not to become a citizen scientist today!

About the author: Michaela Burns is an Oak Ridge Associated Universities contractor and writer for the science communication team in EPA’s Office of Research and Development.

Editor's Note: The opinions expressed herein are those of the author alone. EPA does not verify the accuracy or science of the contents of the blog, nor does EPA endorse the opinions or positions expressed. You may share this post. However, please do not change the title or the content. If you do make changes, please do not attribute the edited title or content to EPA or the author.

EPA's official web site is www.epa.gov. Some links on this page may redirect users from the EPA website to a non-EPA, third-party site. In doing so, EPA is directing you only to the specific content referenced at the time of publication, not to any other content that may appear on the same webpage or elsewhere on the third-party site, or be added at a later date.

EPA is providing this link for informational purposes only. EPA cannot attest to the accuracy of non-EPA information provided by any third-party sites or any other linked site. EPA does not endorse any non-government websites, companies, internet applications or any policies or information expressed therein.

Scientists vs. Rock Stars

By Dr. Rebecca Dodder

My family is probably not typical.  We lean toward the science geek end of the spectrum.  I’m a scientist, my husband is an engineer, and our kids like math and science much more than any subject, unless recess is a subject.  My kids could tell you who Neil deGrasse Tyson is, but would be hard pressed to point out Justin Bieber or Rihanna in a crowd.  The fact that Justin Bieber is one of the few examples I can think of, probably speaks to how truly uncool I am.  Don’t quiz me on famous actors, singers, YouTube sensations, or popular TV commercials.

Scientists often don’t get visible recognition for the important work that we do.  Popularity is saved for the truly impactful, like funny animal video compilations.  So, when I found out in February that I would be visiting the White House as part of the Presidential Early Career Award for Scientists and Engineers, I thought that this was one of the brief and fleeting moments when I would be at least on the edges of the limelight — meeting the President — because of doing science as well as outreach to communities.

President Barack Obama joins recipients of the 2013 Presidential Early Career Award for Scientists and Engineers (PECASE) for a group photo in the East Room of the White House, May 5, 2016. (Official White House Photo by Lawrence Jackson)

President Barack Obama joins recipients of the Presidential Early Career Award for Scientists and Engineers (PECASE) for a group photo in the East Room of the White House, May 5, 2016. (Official White House Photo by Lawrence Jackson)

The ceremony included more than 100 scientists and engineers that had been nominated by National Science Foundation, Departments of Commerce, Defense, Energy, etc. and of course, EPA.  From my perspective, I was in a room with rising stars in science and engineering.  Individuals who had also reached out to students and their communities, connecting their science to people’s lives through mentoring and through service.  There were awards for work on cancer, digital forensics, antibiotic resistance, star evolution, self-healing metals, and my favorite, planetary protection.  I know our EPA Mission is protecting human health and the environment, but the whole planet?  That’s taking it up a notch.  However, another awardee told me that his “favorite agency” was the EPA.  Take that NASA.

We took the group picture in a large lovely room, with President Obama in front middle.  We had waited for a while, careful not to lock our knees, pass out, and fall off the podium.  Strangely enough, there was a stage, microphones, drums, and amplifiers on one side of the room.  Some of us made jokes about who could sing, but that was more of a side thought as we all waited for the President to walk in the room.  Then, he came, and spoke of the importance of science and engineering, of continuing to drive discovery and innovation, and of taking on challenging and complex issues.  We shook some other hands, John Holdren of the White House Office of Science and Technology Policy, and Jeff Bezos CEO and founder of Amazon.com.  Then we left.

The funny thing was — as we all walked out of the East Room, down the halls, and out of the White House, with this absolutely strange and dazed feeling of having just shook the hand of one of the most prominent people in the world — I remember passing another smaller group coming in, apparently heading into the same room from which we just came.  I remember thinking that, in my opinion, they were way underdressed to meet the President.  They were dressed mostly in black, a bit grungy in a rock star kind of way.  No suits, no ties.

Later on, I was looking at the White House website, and saw that the group I had seen was a hugely popular Mexican rock band, Maná, which could be described as the U2 of Mexico. I actually know and really like the band’s music, I just didn’t happen to recognize them.  The date was May 5th, Cinco de Mayo, and they were doing for a concert for the President.  The lesson is that rock stars are rock stars, and as scientists we continue the work that protects the environment, improves lives, and maybe even protects Earth’s biosphere from returned extraterrestrial samples just in case we do find life elsewhere.  And every once in a while, we will have our moments of glory, however brief.  And then we get back to work.

About the Author: Rebecca Dodder is a Physical Scientist specializing in the use of energy system modeling tools to assess issues related to biomass and biofuels, agriculture-energy linkages, the water-energy nexus, and the broader life cycle impacts of energy choices.  Rebecca holds a PhD in Technology, Management and Policy from MIT, where she worked with a research program on air quality in Mexico City.

Editor's Note: The opinions expressed herein are those of the author alone. EPA does not verify the accuracy or science of the contents of the blog, nor does EPA endorse the opinions or positions expressed. You may share this post. However, please do not change the title or the content. If you do make changes, please do not attribute the edited title or content to EPA or the author.

EPA's official web site is www.epa.gov. Some links on this page may redirect users from the EPA website to a non-EPA, third-party site. In doing so, EPA is directing you only to the specific content referenced at the time of publication, not to any other content that may appear on the same webpage or elsewhere on the third-party site, or be added at a later date.

EPA is providing this link for informational purposes only. EPA cannot attest to the accuracy of non-EPA information provided by any third-party sites or any other linked site. EPA does not endorse any non-government websites, companies, internet applications or any policies or information expressed therein.