You are here
Superstorm Sandy LiDAR Damage Assessment to Change Disaster Recovery
Rutgers’ Center for Advanced Infrastructure and Transportation (CAIT), a U.S. Department of Transportation Tier I University Transportation Center, recognized the unique opportunity provided by Hurricane Sandy to learn from and quantify the disastrous effects of a major storm and use that data to help communities prepare for and recover from future extreme weather events.

The team scanned more than 80 miles of coastal communities, including New Jersey's barrier islands such as Seaside Heights (shown in green).
On October 29, 2012, Hurricane Sandy landed on New York and New Jersey, bringing powerful high winds and a storm surge that caused nearly $60 billion in damage to the region’s property, infrastructure, and commerce. In the Northeast, hurricanes are not typical weather events. Coupled with the region’s dense population and intricate transportation network, Sandy’s lasting devastation is considered second only to the damage caused by Hurricane Katrina.
It will take years for some areas to completely recover from Sandy’s effects. Beaches and boardwalks of the iconic Jersey Shore are gone, family homes have been condemned, and roadways destroyed. Businesses have closed their doors. Still, almost immediately after Sandy’s destruction, the region began to rebuild.
However, once the bulldozer starts rolling, critical information—like how different types of infrastructure react to severe weather conditions—is lost.
Keeping infrastructure in a “state of good repair” improves commerce, safety, environmental conditions, and quality of life; as such, repairing and sustaining infrastructure requires proactive management, maintenance, and support. Led by Rutgers civil engineering professor Jie Gong, Ph.D., CAIT teamed up with Ohio-based Woolpert Geospatial Mapping Co. and used mobile Light Detection and Ranging (LiDAR) technology to assess storm damage on buildings, roadways, and utilities in the devastated coastal communities of New York and New Jersey.
The mobile LiDAR system consists of a laser scanner mounted atop a van and acts similarly to a camera, producing images of areas it records. However, unlike a photo, a mobile LiDAR system is capable of instantaneously scanning and collecting millions of distance measurements to create high-precision, three-dimensional models—in other words, a virtual reality. As the vehicle moves across a roadway, the laser scanner “bounces” information back to a computer, where it marries image data to position data collected simultaneously from GPS.

Comparison of infrastructure damage scan--conventional imagery (left) and millions of high accuracy geo-referenced laser data points (right).
During the course of the study, the team scanned roughly 80 miles of storm-ravaged neighborhoods—including Seaside Heights and Mantoloking, New Jersey; selected areas of Staten Island, New York; and Rockaway Beach in Queens, New York. The high-resolution 3-D output will help officials in these municipalities and others develop better response strategies and prepare critical infrastructure to withstand the effects of disaster events. Data collected from CAIT’s Sandy evaluation will help researchers like Gong analyze how different types of infrastructure react to heavy winds or floods. This analysis will prove especially beneficial to USDOT, Federal Emergency Management Agency (FEMA), and city and state government agencies for post-storm damage evaluation and reconstruction.
“[Mobile LiDAR] establishes a high-resolution and accurate baseline of existing communities for disaster preparation,” Gong says. “Archiving the collected 3-D images provides a record for officials to reference during and after future disasters.”
Understanding which types of structures historically sustained damage —and which ones survived—can help officials implement more efficient demolition, recycling, and reconstruction efforts, but Gong believes mobile LiDAR can revolutionize recovery efforts in another way. The technology’s fast and accurate data collection not only produces highly-detailed images, but expedites the rebuilding process itself. In the past, traditional assessments consisted of preliminary damage evaluation, followed by reconstruction surveying. With mobile LiDAR, disaster assessment can become a quicker process that concurrently uses a survey grade mapping system while producing 3-D condition data. With data extraction, the team can produce survey drawings—halving the time it would take to assess hard-hit areas.
The technology can also contribute in other ways. Gong is working on another project under the Illinois Department of Transportation to determine road crash ratings using mobile LiDAR. Those findings will help decision-makers implement data-driven safety improvements to keep highways and roadways running at peak efficiency.
Is mobile LiDAR the future of assessment and research? Gong thinks so, but not without limitations.
“As with any evolving technology, large volumes of data and lack of automated post-processing tools present a roadblock to widespread adoption,” Gong says. “CAIT’s mission to maintain a ‘state of good repair’ goes beyond those limitations; the data gathered from the Sandy study will have much more of an impact on the long-ranging health of our infrastructure than a disaster ever will.”
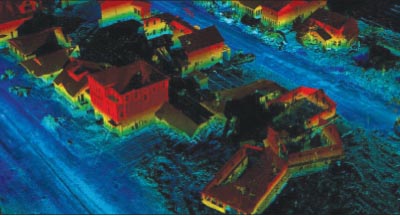
High resolution LiDAR data used to create 3-D environments providing an archive of Sandy devastation.
About This Project
CAIT affiliated faculty Jie Gong, Ph.D. (jg931@rci.rutgers.edu), led this research. The support of the following people is gratefully acknowledged: Nenad Gucunski, Ph.D. of the CAIT Infrastructure Condition Monitoring Program (ICMP); CAIT associate director Patrick Szary, Ph.D.; and Trefor Williams, Ph.D. of the CAIT Information Management Group (IMG). The team also thanks Ning Lin, Ph.D., of Princeton University; Andrew Kennedy, Ph.D., of the University of Notre Dame; and B. Steven Howard from Stockton College for their valued support on this project. Rutgers’ CAIT is a Tier 1 UTC led by Ali Maher, Ph.D. (mmaher@rutgers.edu).