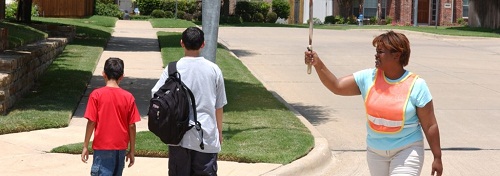
Photo source: NHTSA
Relationship to public health
Motor vehicle collisions are one of the leading causes of unintentional death in the United States. In 2013, more than 32,000 people died in motor vehicle collisions, including 4,735 pedestrians and 743 cyclists. That year more than 2.3 million people were injured in motor vehicle collisions, including 66,000 pedestrians and 48,000 cyclists. Transportation agencies can reduce injuries and deaths associated with transportation systems in several ways:
1. Design safer streets that protect all users of the transportation system, particularly vulnerable users such as pedestrians and cyclists. Potential safety improvements include design elements such as speed bumps or traffic circles to reduce vehicle speeds. Other elements include bicycle lanes and sidewalks that create a dedicated travel space for cyclists and pedestrians.
2. Promote safe behavior, such as
- avoiding drunk, drugged, drowsy, or distracted driving;
- showing respect for and sharing the road safely with all other users;
- always using age- and size-appropriate car seats, booster seats, and seat belts; and
- obeying the rules of the road.
Safe driving behaviors can be encouraged by enacting new laws and policies and working with law enforcement to enforce existing safety laws. They also can be encouraged by engaging in community-based education and outreach efforts using varying communication outlets consistently over time.
3. Improve access to desired destinations so people can eliminate some car trips and further decrease their potential exposure to motor vehicle collisions.
In addition, transportation agencies can coordinate with land use agencies to plan communities for which destinations are located closer to homes. That can reduce driving distances, thereby reducing potential exposure to collisions for all users of the transportation system. These strategies are particularly important in low-income areas and minority communities, where many people rely on walking or bicycling to reach destinations. Inadequate or substandard infrastructure in such areas can lead to higher incidences of collisions involving pedestrians and cyclists.
Related indicators in the THT
Commute mode share describes the percentage of residents who use public transportation to travel to work.
Person miles traveled by mode describes the relative distance that people travel using public transportation.
Alcohol-Impaired fatalities measures the number of drivers (per 100,000 people) who are killed while driving under the influence of alcohol or drugs.
Seat belt use describes the percentage of roadway users who wear seat belts, based on an observational survey of drivers and passengers.
Use of federal funds for bicycle and pedestrian efforts describes the extent to which transportation agencies are using discretionary federal funding to create or improve facilities that often increase safety for vulnerable users of the transportation system.
Complete streets policies describe the extent and effectiveness of policies to create streets that accommodate bicyclists, pedestrians, and traffic riders, along with motor vehicles.
Road traffic fatalities by mode measures the fatality rate per 100,000 people for drivers, pedestrians, and bicyclists, without accounting for the relative amount that people travel by each mode.
Road traffic fatalities exposure rate measures the relative safety of different modes of travel (vehicle, pedestrian, and bicycle) by dividing fatalities by mode by commute mode share.
Public transportation trips per capita describes how often people ride public transportation.
Resources
National Highway Traffic Safety Administration's Driving Safety Information
NHTSA provides targeted information, including research, publications, and outreach materials on safe transportation, covering
- specific modes of travel (motorcycles, bicycles, pedestrians),
- segments of the population (older drivers, teen drivers, children),
- risk behaviors (aggressive driving, distracted driving, impaired driving), and
- occupant restraints (car seats, booster seats, seat belts).
Federal Highway Administration Office of Safety
The Office of Safety website provides targeted information on initiatives and other resources transportation agencies can use to design and build safer facilities. The site includes information on road safety audits, proven safety countermeasures, capacity building, and road crash and safety statistics.
Fatality Analysis Reporting System (FARS) Encyclopedia
The Fatality Analysis Reporting System (FARS) Encyclopedia provides statistics on injuries and deaths from vehicle crashes in the United States. Users can view summary data on U.S. vehicle accidents or collect customized data, such as accidents by location or vehicle type.
Safe Transportation Research and Education Center (SafeTREC)
The Safe Transportation Research and Education Center (SafeTREC) at the University of California, Berkeley, provides research on a various topics related to transportation safety, including crash analysis, facility analysis, bicycle and pedestrian safety, and occupant safety.
Centers for Disease Control and Prevention’s Injury Prevention & Control: Motor Vehicle Safety
CDC’s “Injury Prevention & Control: Motor Vehicle Safety” webpage provides state motor vehicle occupant deaths by state, cost data and prevention policies, and information pertinent to child passenger safety, seat belts, driving populations, and pedestrian safety.
Research Studies
Motor Vehicle Traffic Crashes as a Leading Cause of Death in the United States, 2008 and 2009
This report examines historic trends in number of vehicle fatalities and their rank as a cause of death over nearly three decades.
U.S. Department of Transportation National Highway Traffic Safety Administration. (2012). Motor Vehicle Traffic Crashes as a Leading Cause of Death in the United States, 2008 and 2009.
Countermeasures that Work: A Highway Safety Countermeasure Guide for State Highway Safety Offices
This resource summarizes countermeasures to a variety of highway safety issues, including lack of seat belt use, aggressive driving, distracted driving, and young drivers. For each countermeasure, the report evaluates cost, effectiveness, and time to implement. It also summarizes relevant research and gives examples.
National Highway Traffic Safety Administration. 2013. Countermeasures that Work: A Highway Safety Countermeasure Guide for State Highway Safety Offices.
This report identifies engineering measures that have the greatest potential to prevent pedestrian-motor vehicle crashes. These include measures to control speed, separate pedestrians from vehicles, and make pedestrians more noticeable to drivers.
Retting R, Ferguson S, McCartt A. A review of evidence-based traffic engineering measures designed to reduce pedestrian–motor vehicle crashes. American Journal of Public Health 2003;93(9):1456-1463.
Evaluating the Safety Effects of Bicycle Lanes in New York City
This report evaluates the effects of bicycle lanes installed before 2007 on different categories of crashes, including those involving bicyclists and pedestrians. It also identifies additional measures that can further prevent crashes involving bicyclists.
Chen L, Chen C, Srinivasan R, McKnight C, Ewing R, Roe M. Evaluating the safety effects of bicycle lanes in New York City. American Journal of Public Health 2012;102(6):1120-1127.
This report calculates fatal and nonfatal traffic injury rates per person-trip in the United States using nationwide traffic exposure data.
Beck L, Dellinger A, O’Neil M. Motor vehicle crash injury rates by mode of travel, United States: using exposure-based methods to quantify differences. American Journal of Epidemiology 2007;166(2):212-218.
Safe Travels: Evaluating Mobility Management Traffic Safety Impacts
The authors evaluate the potential of strategies to encourage mode shift, manage congestion, and reduce traffic speeds to reduce the rate of traffic collisions.
Litman T, Fitzroy S. Safe travels: evaluating mobility management traffic safety impacts. Victoria Transport Policy Institute 2013.