FTA Grants Awarded FY 2006-2015
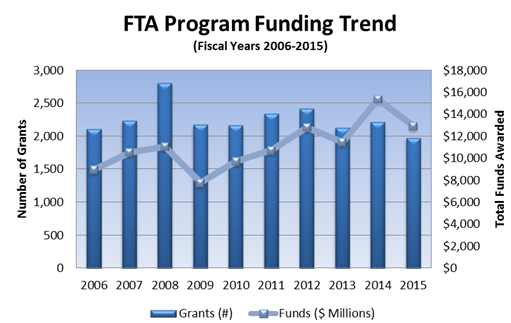
Note: Data does not include Grants Funded by the Recovery Act.
| Award Year | Total Grants Awarded (#) | Total Funds Awarded ($ Millions) |
|---|---|---|
| 2006 | 2,108 | $8,958,967,075 |
| 2007 | 2,236 | $10,509,584,300 |
| 2008 | 2,804 | $11,034,334,990 |
| 2009 | 2,175 | $7,762,001,670 |
| 2010 | 2,163 | $9,712,517,445 |
| 2011 | 2,339 | $10,720,627,146 |
| 2012 | 2,414 | $12,773,074,271 |
| 2013 | 2,130 | $11,456,868,229 |
| 2014 | 2,219 | $15,339,219,098 |
| 2015 | 1,970 | $12,902,588,792 |
| Total | 22,558 | $111,169,783,016 |
Transit Ridership Versus Average Gas Price and Employment (full Chart)
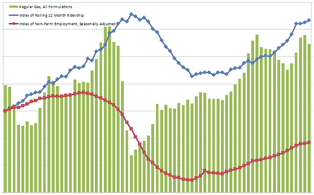
This exhibit contains data from July 2006 to May 2013.
Fiscal Year 2015 Information
Dashboards
Historic Data
Annual Statistical Summaries
National Transit Database
- NTD Home Page
- NTD Data Highlights (PowerPoint)
- NTD 2010 Summaries and Trends (PDF)
- 2010 National Aggregate Data Profile (PDF)
- 2010 Profiles of Top 50 U.S. Transit Agencies (PDF)
- 2010 Profiles of all Reporting U.S. Transit Agencies (PDF)
- Search U.S. Transit Agency Profiles
Condition & Performance Reports
FTA Data Resources
Other Transit Data Resources
Updated: Wednesday, October 19, 2016