USGS - science for a changing world

North Dakota Water Science Center

home home information/data information/data publications publications FAQs FAQs links links about us about us contact contact internal internal

USGS North Dakota Water Science Center


 What's New

 USGS WaterAlert

 Data Center

 Information Center

 USGS in Your State


USGS Water Science Centers are located in each state.

There is a USGS Water Science Center office in each State. Washington Oregon California Idaho Nevada Montana Wyoming Utah Colorado Arizona New Mexico North Dakota South Dakota Nebraska Kansas Oklahoma Texas Minnesota Iowa Missouri Arkansas Louisiana Wisconsin Illinois Mississippi Michigan Indiana Ohio Kentucky Tennessee Alabama Pennsylvania West Virginia Georgia Florida Caribbean Alaska Hawaii New York Vermont New Hampshire Maine Massachusetts South Carolina North Carolina Rhode Island Virginia Connecticut New Jersey Maryland-Delaware-D.C.


 Connect with USGS

USGSND - Follow USGSND on Twitter
USGSND - YouTube - USGSND

RSSPublications
RSSUSGS News Releases
RSSFAQs
What is RSS?


Drought Watch

Real-time streamflow for North Dakota

Map of below normal 7-day average streamflow compared to historical streamflow for the week of the year

 Hydrologic Conditions

 Below normal 7-day average streamflow by basin

 Below normal 7-day average streamflow by station

 Below normal 14-day average streamflow by station

 Below normal 28-day average streamflow by station

The "Below normal streamflow " map shows the average streamflow conditions for the past seven days, highlighting locations that are experiencing low flows or hydrologic drought. By averaging over an entire week, the values on the map are more indicative of longer-term streamflow conditions than either the "Real-time streamflow" or the "Daily streamflow" maps.

The map depicts 7-day average streamflow conditions as computed at USGS gaging stations. The colors represent 7-day average streamflow compared to percentiles of historical weekly streamflow for the week of the year. This map represents conditions adjusted for this time of the year. Only stations having at least 30 years of record are used. 

During winter months, fewer dots may appear than at other times of the year due to ice effects. The data used to produce this map are provisional and have not been reviewed or edited. They may be subject to significant change.

Explanation
color code for 11th-25th percentile Below
Normal
10th-24th
percentile
color code for 6th-10th percentile Moderate
Hydrologic
Drought
6th-9th
percentile
color code for less than 5th percentile Severe
Hydrologic
Drought
≤ 5th
percentile
color code for lowest 7-day flow Extreme
Hydrologic
Drought
New low
color code for not ranked Not ranked
 

USGS Water Watch
For information on drought and water resources throughout the United States, please visit WaterWatch.
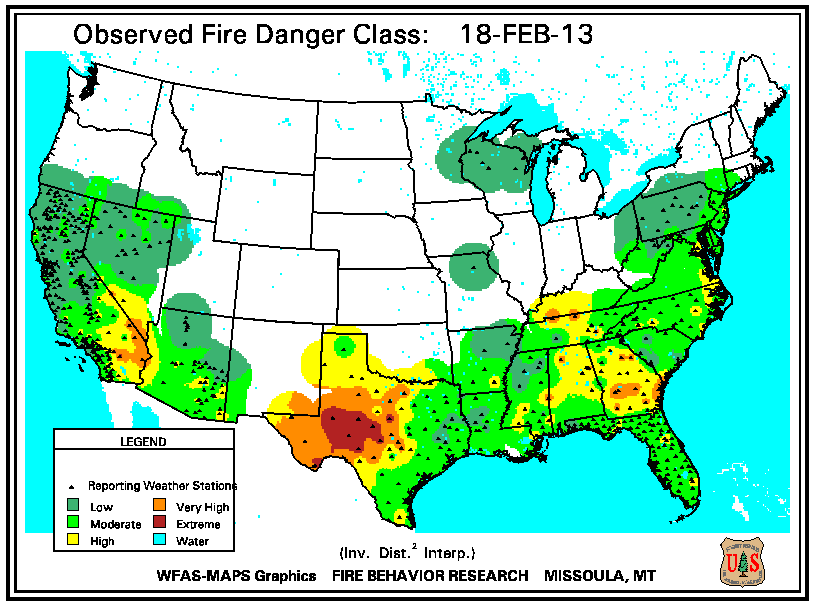

 Drought Indicators


Click on one of the maps below to see the full image.

USGS - United States Streamflow Conditions
US Streamflow Conditions
USGS - Basins where the 7-day average streamflow is below normal
Map of below normal 7-day average streamflow compared to historical streamflow for the day of the year
United States Drought Monitor
US Drought Monitor
Palmer Drought Severity Index
Seasonal United States Drought Outlook
Seasonal US Drought Outlook
Fire Danger
US Fire Danger
Crop Moisture Index
Crop Moistrue Index
Other Maps

Standardized Precipitation Index

Mountain Snowpack Maps for Missouri River Basin

SNOTEL - River Basin Snow Water Content
 

Pictures of Drought-Affected Streams


Latest Condition Reports
Streams

Weather - Western North Dakota

Weather - Eastern North Dakota

Agriculture

Frequently Asked Questions


What is a drought?

When does a drought begin?

Does a shortage of rain mean a drought will occur?

Where do droughts usually occur?

What can be done to solve water problems during periods of drought?

When has North Dakota experienced droughts?

Drought Information from the U.S. Geological Survey


Publications
Climatic and hydrologic aspects of the 1988-92 drought and the effect on people and resources of North Dakota - North Dakota State Water Commission Water Resources Investigation 29
 
Drought - U.S. Geological Survey Open File Report 93-642
 
Droughts of 1930-34 - U.S. Geological Survey Water-Supply Paper 680
 
Drought of 1936, with discussion on the significance of drought in relation to climate - U.S. Geological Survey Water-Supply Paper 820
 
Ground-water-level monitoring and the importance of long-term water-level data - U.S. Geological Survey Circular 1217
 
Proposal and work plan to calibrate and verify a water-quality model to simulate effects of wastewater discharges to the Red River of the North at drought streamflow near Fargo, North Dakota, and Moorhead, Minnesota - U.S. Geological Survey Open-File Report 00-190
 
Stream-gaging program of the U.S. Geological Survey - U.S. Geological Survey Circular 1123
 
Search publications of the U.S. Geological Survey
 
 
Map of real-time streamflow compared to historical streamflow for the day of the year
North Dakota
Montana
South Dakota
Minnesota
 
Conditions across the nation
Map of real-time streamflow compared to historical streamflow for the day of the year (United States)
States where average streamflow was below normal during the previous 7 days
Ground Water Climate Response Network

Drought Information from State and Regional Agencies


State
Coping with Drought Information for Dealing with Dry Weather - North Dakota State University
 
Region
Western Governors' Climate Change and Adaptation Initiative

Drought Information from Other Federal Agencies and National Organizations


National Oceanic and Atmospheric Administration
Climate Prediction Center
Drought Information Center
Historic Palmer Drought Indices
National Climatic Data Center
National Integrated Drought Information System
North American Drought: A Paleo Perspective - Created by the staff of the NOAA Paleoclimatology Program
 
National Weather Service Forecast Offices
Bismarck | Grand Forks | Glasgow | Billings | Rapid City | Aberdeen | Minneapolis | more...
 
Other Agencies
Water Supply Outlook for the Western United States - USDA/NRCS/National Water & Climate Center
 
National Drought Mitigation Center - University of Nebraska - Lincoln
 
The Drought Monitor - a comprehensive drought monitoring effort between the USDA, NOAA/Climate Prediction Center, NOAA/National Climate Data Center, and the National Drought Mitigation Center


To Top of Page


Accessibility FOIA Privacy Policies and Notices

Take Pride in America logo USA.gov logo U.S. Department of the Interior | U.S. Geological Survey
URL: http://nd.water.usgs.gov/drought/index.html
Page Contact Information: Webmaster
Page Last Modified: Thursday, 10-Jan-2013 17:17:41 EST
Sioux Falls, SD [sdww54]