
Illustrated by Kristen Crossett, NOAA Office of Coast Survey

Illustrated by Kristen Crossett, NOAA Office of Coast Survey
Coast Survey welcomed Cuban colleagues to NOAA offices this week, as representatives of Cuba’s National Office of Hydrography and Geodesy (ONHG) traveled to Maryland for the first time since last December. In March, NOAA and ONHG signed a Memorandum of Understanding in Havana.
“We’ve identified a broad sweep of navigation issues for collaboration, and we’ve started to produce tangible results,” said Dr. Russell Callender, assistant administrator of NOAA’s National Ocean Service, at the start of three days of work sessions. “On behalf of NOAA, I’d like to express my appreciation for the progress made by our two agencies.”
The MOU, which is focused on improving maritime navigation safety and related areas of mutual interest to protect lives and property at sea, is the framework for continuing consultations between NOAA’s National Ocean Service and ONHG.
“The collaboration between our two countries is the way to move forward,” said Dr. Candido Alfredo Regalado Gomez, chief of Cuba’s National Office of Hydrography and Geodesy. “We are here to work.”

Cuba’s ONHG director, Dr. Candido Alfredo Regalado Gomez (left) and Coast Survey director Rear Adm. Shepard Smith greet each other at the beginning of the three-day working session, with translation offered by NOAA’s Gonzalo Cid (center).
Among other hydrographic discussions, representatives from both agencies will review, revise, and hopefully approve a planned new international chart (INT chart 4149), the first cooperative charting product between the United States and Cuba during the modern era. NOAA expects to release the new chart in mid-December, at a meeting in Brazil of hydrographic officials from the Western Hemisphere. The chart covers south Florida, the Bahamas, and north Cuba, a popular area for both recreational boaters and commercial mariners.
The publication of the new international chart, along with alignment of U.S. and Cuba electronic navigational charts, will resolve many navigational issues as vessels move across the shared maritime border.
In addition to charting, the U.S.-Cuba dialogue has expanded to include an emerging geodetic component. NOAA’s National Geodetic Survey will discuss current datums (North American Datum of 1983 and North American Vertical Datum of 1988) and plans to transition to new datums by 2022. Discussions include both geometric (latitude and longitude) and geopotential (vertical coordinate referenced to Earth’s mean sea level) issues.
Representatives from both agencies have expressed additional interest in tide and current monitoring, modeling, and forecasting. The exchange of data and information will improve the accuracy and quality of these products, as closer direct dialogue between Cuban and NOAA hydrographic offices promises to improve navigation safety in the Florida Straits, the Gulf of Mexico and the wider Caribbean.
Thanks to a combination of determination and technical advancements, Coast Survey was able to locate, report, and chart a danger to navigation within two weeks – a major improvement over the three-to-ten-year chart update protocol of only a few years ago.
On Monday, November 14, a Coast Survey navigation response team hit the waters of St Simons Sound, off the coast of Georgia, when the U.S. Coast Guard asked us to find a sunken fishing vessel. By the next morning, the team of James Kirkpatrick and Kyle Ward (who augmented on the project, from his normal duty as navigation manager in Charleston), reported to the Coast Guard, noting that the wreck is very shoal. They also observed recreational vessels transiting the area every 10 to 15 minutes. Coast Survey quickly issued an official Danger to Navigation Report.
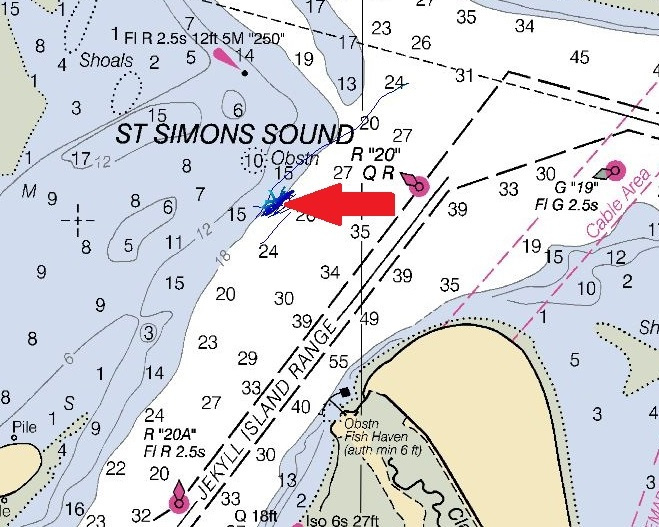
Location of the wreck

Wreck as seen with multibeam echo sounder

Wreck as seen with side scan sonar
The team’s hydrographic data determined a least depth of 0.4 meters (1.3 feet) at position 31-07-34.41N// 081-25-15.88W. The vessel appears to be lying on its port side with the bow pointing in an approximate SE orientation with the stern slightly higher than the bow. The least depth appears to be on some type of rigging or fishing gear protruding from the midship area.
Recognizing that a boat could easily hit the submerged wreck, the navigation response team asked Coast Survey cartographers to quickly add it to the charts. The cartographers acted immediately, applying the wreck symbol to paper, raster, and electronic charts of the area. The cartographers, working with branch chief Ken Forster, will publish the updated charts with the next cycle of weekly updates, scheduled for Wednesday, November 23.

Coast Survey is updating charts 11506 and 11502, and ENCs US5GA13M and US4GA11M
Finding and charting dangers to navigation are our highest priorities. We encourage mariners who suspect dangers, or who want to report any chart discrepancy, to file a fast and easy report on our website.
NOAA has issued a new nautical chart for the Port of Palm Beach, Florida, an important distribution center for commodities being shipped all over the world, and especially the Caribbean Basin.
The Port of Palm Beach operations include containerized, dry bulk, liquid bulk, break-bulk, and heavy-lift cargoes. It is the only port in South Florida with an on-dock rail where the Florida East Coast Railway provides twice-daily service to the port’s rail interchange.

NOAA’s new nautical chart (11459) for the Port of Palm Beach, Florida.
The Palm Beach Harbor Pilots Association asked Coast Survey for the new chart, citing the dangers confronting navigators who approach the port and anchor offshore using the small scale coverage and corresponding lack of detail currently available on chart 11466 (1:80,000). With more and bigger vessels entering the port, the larger scale inset helps pilots navigating within the turning basin and surrounding infrastructure. This is especially important because it is located within the traffic flow of the Intracoastal Waterway.
In consultation with the Palm Beach Pilots, the U.S. Coast Guard Sector Miami, Port of Palm Beach (Operations Division), and the Army Corps of Engineers Jacksonville District, Coast Survey developed the new chart specifications. All parties agreed that the new 1:15,000 scale chart and a 1:5,000 scale inset would enhance navigational safety and greatly benefit port operations.
In order to create the new chart, new data had to be collected. The National Geodetic Survey’s Remote Sensing Division collected additional bathymetric lidar data along the shoreline and Coast Survey’s navigation response team collected hydrographic data in the area just beyond where the U.S. Army Corps of Engineers data ends.

A larger scale chart for the Port of Palm Beach required additional data be collected by the National Geodetic Survey’s Remote Sensing Division and Coast Survey’s navigation response team.
History is never completely written. There are always new discoveries, new understanding.
NOAA historian John Cloud recently sent Coast Survey an intriguing report:
Yesterday I was looking for some historic Chesapeake Bay T sheets [topography drafts]… Anyway, down in the bottom of a folder, there was a zipped file, dated 2009, never unzipped. I thought: well, since I have noticed this now, why don’t I unzip it? It turned out to be two overly rescaled jpgs, but using my Keith Bridge tricks [a technique developed by a former Coast Survey historical chart expert] I found the two full-scale originals. It was one chart, with a small part cut off to make two separate files: the original 1838 hydrography for New Haven Harbour!
This is the basis for the 1838 engraved chart for Congress, the second published Coast Survey chart. (The first was based on Lt. Gedney’s partial survey of Newark Bay, NJ and the mouth of the Hackensack River, 1837.) The New Haven work was 1838. In 1839, the same Lt. Gedney and company captured the slave ship Amistad and brought the ship and captives to New Haven, claiming the escaped slaves as property. [UPDATE, 10/27/2016: Delving deeper into Gedney’s actions, it turns out he docked the ship in New London, while the captive Africans were brought to New Haven.] Then later, John Quincy Adams persuaded a judge they had freed themselves on the boat and were no longer slaves.
Unzipping the files happened within an hour or so of getting an email from Michelle Zacks, a scholar of marine environmental history who has explored historic Coast Survey field survey notebooks as sources for her ongoing project on the antebellum oyster industry and the lives of enslaved and free African Americans in the Chesapeake region. That research helped lead to her new job, as the associate director of the Gilder Lehrman Center for the Study of Slavery, Resistance, and Abolition, at Yale, which is in: New Haven!
It all happened just like that! Like the chart “wanted” to emerge back into the Amistad story.


We weren’t able to trace the origination of that zip file, but it was obviously created by someone who didn’t realize the value of the historical images. And this, ladies and gentlemen, is why we value historians.
Matthew became a hurricane on Thursday, September 29, and it was soon clear that NOAA’s navigation services would be called into action. Coast Survey knew they would be needed for the maritime transportation system’s rapid recovery operations, to search for underwater debris and shoaling. That Saturday, while Hurricane Matthew was still three days away from hitting Haiti, Coast Survey was already ramping up preparations for assisting with reopening U.S. shipping lanes and ports after Matthew’s destruction. By Monday, as NOAA’s National Hurricane Center zeroed in on a major hit to the southeast coast, Coast Survey’s navigation service personnel began moving personnel and survey vessels for rapid deployment. Calling in survey professionals from as far away as Seattle, teams were mobilized to locations outside of the hurricane’s impact zones, so they would be ready to move in and hit the water as soon as weather and ocean conditions allowed.

NOAA Ship Ferdinand R. Hassler‘s survey technicians are on duty 24/7 while the ship surveys port areas after Hurricane Matthew.
Coast Survey prepared two navigation response teams – small vessels with 3-person crews – and NOAA Ship Ferdinand R. Hassler for survey work prioritized by the U.S. Coast Guard, in coordination with the U.S. Army Corps of Engineers, ports, terminal operators, state officials, and local emergency responders. Two navigation managers, Kyle Ward (Southeast) and Tim Osborn (Central Gulf of Mexico), were augmented by Lucy Hick and Michael Davidson, navigation services personnel in Silver Spring, Maryland, to coordinate personnel safety, property protection, and navigation service delivery before, during, and after the storm.

NOAA Ship Hassler surveyed channels in the Charleston Harbor and Port of Savannah, using multibeam echo sounders. Shown here are Lt. Cmdr. Steven Kuzirian (left) and Lt. Cmdr. John French surveying in Charleston.

Two of Coast Survey’s navigation response teams helped reopen ports after Hurricane Matthew. Photo of NRT4 at Port Canaveral, by Tim Osborn.
Tim Osborn, who deployed to Port Canaveral from Baton Rouge, is a veteran of NOAA’s many hurricane responses in the Gulf of Mexico ports. Osborn lent his expertise and experience to the Port Canaveral pilots, port officials, and U.S. Coast Guard, as they quickly resumed operations. While the port re-opened on October 8 for cruise ships during daylight hours, they needed a Coast Survey navigation team, working in coordination with a private survey company contracted by the port, to search for dangers to navigation for the deeper draft vessels. Navigation Response Team 4 (Dan Jacobs, Mark McMann, and Starla Robinson) worked through the day on October 9, and the port was subsequently opened for full operations.


As luck would have it, NOAA Ship Ferdinand R. Hassler, commanded by Lt. Cmdr. Matthew Jaskoski, was surveying the approaches to Wilmington, North Carolina, this fall. They broke off survey operations and headed to Charleston as Hurricane Matthew approached, so they were in position to assist with reopening that port. Knowing they would need additional technical help for around-the-clock operations, physical scientist James Miller drove from his NOAA office in Norfolk to Charleston (the normally six-hour trip taking over 14 hours, due to flooded roads) to augment Hassler‘s normal complement of scientists. As soon as conditions were safe, on October 9, Hassler went to work. From 9:30 a.m. to 5:00 p.m., Hassler surveyed 50 nautical miles. They processed their data, checking it for dangers to navigation, and got their report to the U.S. Coast Guard by 6:40 that evening. Armed with Hassler’s report, along with data from the Army Corps of Engineers, the U.S. Coast Guard was able to reopen the port with restrictions by about 7:00 p.m.

Ferdinand R. Hassler’s next assignment was to assist with survey operations at the Port of Savannah. After waiting for safe transit conditions in departing Charleston, they arrived in Savannah in the late afternoon of October 11, joining Coast Survey’s Navigation Response Team 2 (James Kirkpatrick, Lucas Blass, and Ian Colvert), who had been surveying there since October 9. The U.S. Army Corp of Engineers (USACE) also surveyed, as shown below. With offshore conditions too choppy for small boat survey operations, Hassler went to work surveying Savannah’s entrance channel, planning to survey for about ten hours into the night. They hope to deliver their report to the Coast Guard before daylight on October 12.
UPDATE (10/13/2016): Hassler finished the Savannah survey at about 9:30 p.m. on Oct. 11, and started transiting to their next assignment ten minutes later. The ship’s physical scientists continued working on the Savannah data, and were able to deliver their report to the Coast Guard at about 11:45 p.m.

(Not for navigation)
Next, Hassler will join with Navigation Response Team 4 for surveying at the Port of Brunswick, to work with the Georgia Port Authority, the U.S. Coast Guard, the harbor pilots and the USACE to reopen the port to commercial vessel traffic. NRT4 completed inshore survey operations on October 11, and Hassler will survey the offshore area on October 12.
UPDATE (10/13/2016): Hassler arrived at Brunswick at about 3:00 a.m. on October 12, but the sea was too rough for surveying the approach and entrance channel. Ultimately, conditions did not improve during the day, and Hassler had to demobilize and return to Charleston.

UPDATE 10/13/2016: Due to unfavorable ocean conditions on October 12, Hassler was not able to survey the area shown in green.

National Weather Service image of Hurricane Matthew near Port Canaveral, Florida on October 7, 2016.
As Hurricane Matthew bore down on Florida, Georgia, and South Carolina, Coast Survey pre-positioned hydrographic survey vessels for immediate deployment, to help speed the reopening of commercial shipping at ports hit by high winds and storm surge.
Currently, our Central Coast Gulf navigation manager, Tim Osborn, embedded in Port Canaveral, Florida, and our Southwest navigation manager, Kyle Ward, are coordinating marine transportation system recovery priorities with the U.S. Coast Guard and port stakeholders in Florida, Georgia, South Carolina, and North Carolina.
Speeding the resumption of commercial vessel traffic has important human and economic considerations. For instance, Port Canaveral experienced winds over 60 knots and wave heights over 30 feet. Cruise ships are awaiting port entry and with about 3,000 passengers per ship, that is over 30,000 passengers (~15,000 crew) waiting for the port to be re-opened.
Video: Port Canaveral experiencing high winds from Hurricane Matthew on October 7, 2016.
An additional aid in the preparation for a hydrographic survey response is anticipating where and how big the storm surge will be along the coast. Just prior to the arrival of Hurricane Matthew, NOAA’s nowCOAST™ updated its system with the National Hurricane Center’s (NHC) potential storm surge flooding map which depicts the risk associated with coastal storm surge flooding resulting from tropical cyclones.

NHC’s first potential storm surge flooding map for Hurricane Matthew on nowCOAST.
![]()


