|

Press Release 08-115
Species Have Come and Gone at Different Rates than Previously Believed

Improved understanding of the history of biological diversity has implications for future responses to climate change
July 3, 2008
View a video interview with researcher John Alroy of the National Center for Ecological Analysis and Synthesis.
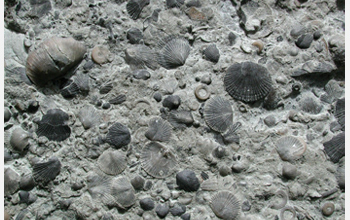
Diversity among the ancestors of such marine creatures as clams, sand dollars and lobsters showed only a modest rise beginning 144 million years ago with no clear trend afterwards, according to an international team of researchers. This contradicts previous work showing dramatic increases beginning 248 million years ago and may shed light on future diversity. "Some of the time periods in the past are analogies for what is happening today from global warming," says Jocelyn Sessa of Penn State. "Understanding what happened with diversity in the past can help us provide some prediction on how modern organisms will fare. If we know where we have been, we know something about where it will go." Using contemporary statistical methods and a paleobiology database, the researchers report in the July 4 issue of Science, a new diversity curve that shows that most of the early spread of invertebrates took place well before the Late Cretaceous, and that the net increase through the period since, is proportionately small relative to the 65 million years that elapsed. The research team was led by John Alroy of the University of California at Santa Barbara. One key to the new curve is the Paleobiology Database, (http://paleodb.org/cgi-bin/bridge.pl) housed at the National Center for Ecological Analysis and Synthesis, University of California, Santa Barbara. Previous research was based on databases of marine invertebrate fossils that recorded only the first occurrence of an organism and the last occurrence of the organism. There was no information in between for the organism. "Over 30 years ago, researchers looked at the curve they had and considered that perhaps diversity did not increase at all," says Mark E. Patzkowsky of Penn State. "What researchers saw was the diversity curve leveled off for quite some time and then took off exponentially. However, diversity results are strongly controlled by sampling techniques." The new database allows researchers to standardize sample size because it includes multiple occurrences of each fossil. Researchers can randomly choose equal samples from equal time spans to create their diversity curve. This new curve uses 11 million-year segments, but the researchers hope to reduce the time intervals to 5 million years to match the interval of the previous curve, known as Sepkoski. The data for this study contains 284,816 fossil occurrences of 18,702 genera that equals about 3.4 million specimens from 5384 literature sources. The old curve, developed by J. John Sepkoski Jr., used a database that contained only about 60,000 occurrences. The researchers also looked at evenness in diversity. If there are 100 specimens divided into 10 time intervals, they could be divided with 10 individual specimens in each interval, or 91 specimens could be in one interval with one each in the remainder. The more even the distribution, the higher the evenness. "Evenness says something about resource distribution," says Patzkowsky. "Much of invertebrate diversity has been attributed to diversity increase in the tropics, but the curve is not driven by that totally. It seems that 450 million years ago was not so different from today because it also contained more diversity in the tropics." The major points of the Sepkoski curve are still seen in the new curve. Some things that are not seen, such as the decrease in diversity due to the Cretaceous Tertiary (KT) extinction 65 million years ago are not visible because of the scale of the intervals used. The extinction and recovery in the KT took less than 11 million years and so do not show. Some things not seen on the Sepkoski curve include a peak in the Permian. Also unexpected is that the diversity in the Jurassic (206 to 144 million years ago) is lower than diversity in the Triassic (248 to 206 million years ago), indicating a dip and rise in the diversity curve. The curve then rises in the Cretaceous and remains more or less flat after that. The previously thought exponential increase in diversity is not there. "Comparing diversity through time is about how our world works, about the origin of species and how diversity changes with temperature," says Sessa. "If we think that the net increase over time will not get much greater, things are very different from if the diversity increases exponentially." The National Science Foundation and NASA supported this research.
-NSF-

Media Contacts
A'ndrea Elyse Messer, Penn State (814) 865-9481 aeml@psu.edu
Lily Whiteman, National Science Foundation (703) 292-8310 lwhitema@nsf.gov
George Foulsham, University of California, Santa Barbara (805) 893-3071 george.foulsham@ia.ucsb.ued
Program Contacts
Paul Filmer, National Science Foundation (703) 292-7858 pfilmer@nsf.gov
Principal Investigators
John Alroy, National Center for Ecological Analysis and Synthesis (805) 892-2070 alory@nceas.ucsb.edu
The National Science Foundation (NSF) is an independent federal agency that supports fundamental research and education across all fields of science and engineering. In fiscal year (FY) 2009, its budget is $9.5 billion, which includes $3.0 billion provided through the American Recovery and Reinvestment Act. NSF funds reach all 50 states through grants to over 1,900 universities and institutions. Each year, NSF receives about 44,400 competitive requests for funding, and makes over 11,500 new funding awards. NSF also awards over $400 million in professional and service contracts yearly.
 Get News Updates by Email Get News Updates by Email
Useful NSF Web Sites:
NSF Home Page: http://www.nsf.gov
NSF News: http://www.nsf.gov/news/
For the News Media: http://www.nsf.gov/news/newsroom.jsp
Science and Engineering Statistics: http://www.nsf.gov/statistics/
Awards Searches: http://www.nsf.gov/awardsearch/
|