Alabama: State Safety Data Quality (SSDQ) Historical Report
Updated Results:
December 14, 2012
The SSDQ Historical report provides a historical review of a State's performance
over multiple SSDQ runs. It displays the most current quarter's SSDQ results followed by the
last four quarterly SSDQ runs. For detailed information on the State Overall Rating, each measure,
and indicator, select "View Methodology" to access the methodology information.
Considers all nine SSDQ measures and the Overriding Indicator, except measures with a rating of "Insufficient Data." States receive an overall score based on ratings in each of the measures and the Overriding Indicator.
(View Methodology)
Rating Criteria
Rating
Criteria
Good
Minimum of 1 Good Crash Measure, 1 Good Inspection Measure, and 0 Poor
Fair
Maximum of 1 Poor
Poor
2+ Poor OR Red Flagged
MCMIS Run Date
Overall State Rating
Measures
Overriding Indicator †
Completeness
Timeliness
Accuracy
Crash Record
Non-Fatal Crashes
Fatal Crashes
Insp Record
Crash
Insp
Crash
Insp
Insp VIN
Consistency
12/14/2012
No Flag
9/28/2012
No Flag
6/22/2012
No Flag
3/23/2012
No Flag
12/21/2011
No Flag
Crash Record Completeness Measure: Percentage of Driver and Vehicle Crash Data Reported to FMCSA
Determines a rating based on the completeness of driver and vehicle crash data reported to FMCSA.
(View Methodology)
Rating Criteria
Rating
Criteria
Good
Percentage of completed driver and vehicle information is >= 85%
Fair
Percentage of completed driver and vehicle information is 70-84%
Poor
Percentage of completed driver and vehicle information is < 70%
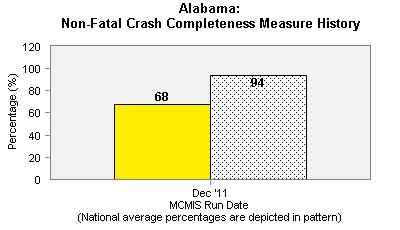
Non-Fatal Crash Completeness: Percentage of Reported to Predicted Non-Fatal Crash Records Reported to MCMIS
Determines a rating based on a ratio of reported to predicted non-fatal crash records reported to MCMIS. The number of reported non-fatal crash records was calculated using a 12-month time period that ends six months prior to the MCMIS snapshot date.
(View Methodology)
Rating Criteria
Rating
Criteria
Good
Percentage of non-fatal crash records reported is >= 75%
Fair
Percentage of non-fatal crash records reported is 50-74%
Poor
Percentage of non-fatal crash records reported is < 50%
Insufficient Data
State has < 15 average # of fatal crash records AND percentage of non-fatal crash records reported is < 50%
Fatal Crash Completeness Measure: Percentage of Fatal Crash Records
Determines a rating based on a comparison of the number of State-reported fatal crash records in MCMIS to the number of fatal crash records reported in FARS.
(View Methodology)
Rating Criteria
Rating
Criteria
Good
MCMIS as a % of FARS is >= 90%
Fair
MCMIS as a % of FARS is 80-89%
Poor
MCMIS as a % of FARS is < 80%
Insufficient data
State has < 15 FARS records AND MCMIS as a % of FARS is < 80%
Crash Accuracy Measure: Percentage of Matched Crash Records
Determines a rating based on the percentage of crash records reported by the State over a 12-month period that were matched to a company registered in MCMIS.
(View Methodology)
Rating Criteria
Rating
Criteria
Good
Percentage of matched records is >= 95%
Fair
Percentage of matched records is 85-94%
Poor
Percentage of matched records is < 85%
Insufficient data
State has < 15 records reported in current timeframe AND percentage of matched records is < 85%
Inspection Accuracy Measure: Percentage of Matched Inspection Records
Determines a rating based on the percentage of inspection records reported by the States over a 12-month period that were matched to a company registered in MCMIS.
(View Methodology)
Inspection VIN Accuracy Measure: Percentage of Valid VIN
Examines the completeness and accuracy of the Vehicle Identification Number (VIN) reported on the first vehicle unit. Data collected during inspection levels 1 through 6 were evaluated.
(View Methodology)
Rating Criteria
Rating
Criteria
Good
Percentage of completed and accurate VIN is >= 85%
Fair
Percentage of completed and accurate VIN is 70 - 84%
Crash Consistency Overriding Indicator: Percentage of State-Reported Non-Fatal Crash Records
Indicates States that have reported less than 50% of non-fatal crash records for the current 12-month period compared to the yearly average, based on the previous 36 months.
(View Methodology)
Rating Criteria
Rating
Criteria
No Flag
No Flag
Estimated Reported is >= 50%
Flag
Estimated Reported is < 50%
Insufficient data
State has < 15 records reported in current timeframe AND State has < 15 records reported in previous 3 year average AND Estimate Reported is <= 50%