0
0 slides
Return to Slide Library
Slides
Rating the Strength of Evidence From the CER
Assays Commonly Used in CDI Diagnostics
Rating the Strength of Evidence From the CER
Number of Studies Evaluating Various Treatment Options
Three Steps To Assess Applicability
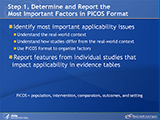
Step 1. Determine and Report the Most Important Factors in PICOS Format
Comparator and Applicability: Examples
Comparator, Outcomes, and Applicability
Evidence Table Template for Applicability
Step 3. Consider and Summarize the Applicability of a Body of Evidence From Individual Studies
Your slide tray is being processed.


 E-mail Updates