Region
Focus Area
Data Type
Displaying 68 Results
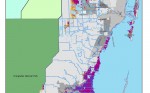
 Adapting to Sea Level Rise in Miami-Dade County, Florida
County departments identify specific actions to adapt to climate change through the Roadmap for Adapting to Coastal Risk training.
 Advancing Restoration in the Great Lakes Region
The Habitat Priority Planner and C-CAP data were used to identify and prioritize habitat restoration projects to meet goals identified in the Great Lakes Regional Collaboration Strategy.
 Analyzing Sedimentation Processes to Guide Conservation in Oregon
C-CAP data helped in the development of a conservation plan for the Yaquina watershed.
 Analyzing the Impacts of Hurricane Katrina on Forest Ecosystem Services
C-CAP data and additional land cover analysis highlight the loss of forests and related ecosystem services following Hurricane Katrina.
 Assessing and Managing Prop Scar Damage to Seagrass in Texas
High-resolution imagery was used to assess and monitor the effect of boating activity on seagrass meadows in Redfish Bay.
 Assessing Beach and Dune Susceptibility in Coastal New Jersey
The Beach-Dune Susceptibility Assessment uses lidar and aerial imagery data to develop a vulnerability rating.
 Assessing Fire Hazard Risk in Southern California
C-CAP data were used to produce additional land cover information to assess the risk of fire and the proximity to urban developments.
 Assessing Hazard Vulnerability and Resilience in Coastal Communities of the Delaware Bay
New Jersey is engaging communities in hazard mitigation planning through the use of vulnerability assessment tools.
 Assessing Hydrologic Processes to Mitigate Coral Reef Degradation in Hawaii
C-CAP data were analyzed using the Nonpoint Source Pollution and Erosion Comparison Tool to understand hydrologic processes in the Hanalei Bay watershed.
 Assessing Land-Based Threats to Coral Reef Habitats in Laolao Bay, CNMI
OpenNSPECT and the Habitat Priority Planner were used to assess land based threats and prioritize restoration areas.
 Assessing Potential Hazard Risk in Tutuila, American Samoa
The Tutuila Hazard Assessment Template (T-HAT) was developed to facilitate the identification of potential multi-hazard risk areas for any location on the main island of Tutuila.
 Assessing the Delaware River Basin Using Land Cover Information
C-CAP data were used in the assessment of water resource health and stability in the Delaware River basin.
 Assessing the Impact of Impervious Surfaces on Water Resources in Southern California
C-CAP data were used to produce additional land cover information to assess the impact of impervious surface on water supply.
 Assessing the Impacts of Hurricane Katrina in Louisiana
C-CAP data were used to evaluate the impacts of Hurricane Katrina in Breton Sound, Louisiana, and assess how this area had recovered almost one year later.
 Bringing Data and Tools to the Restoration Community at a National Conference
Partners unite to put the right Digital Coast data, tools, and training into the hands of communities working to restore vital estuary habitat
 Building Community Resilience on Long Island, New York
The Coastal Resilience Long Island tool is being used by decision makers to gain a better understanding of ecological, social, and economic impacts from coastal hazards.
 Building Technical Capacity in Coastal Maine
GIS service centers were established to build the technical capacity of coastal land trusts.
 Capturing Local Knowledge to Inform Coral Reef Management in Hawai’i
A participatory process was used to map coastal-use data to reduce anthropogenic threats to coral reefs.
 Capturing Traditional Knowledge to Inform Restoration Planning in Hawai’i
Participatory mapping incorporates traditional knowledge into coastal planning and restoration.
 Compiling Natural Resource Data for Watershed Strategies in Hawaii
The Habitat Priority Planner was used with C-CAP high-resolution land cover data to compile natural resource data for community consideration of a range of watershed management strategies.
 Conserving and Restoring New York's Estuarine Habitats
Benthic habitat maps were used to support conservation and restoration efforts in New York’s South Shore Estuary Reserve.
 Conserving Habitat for the New England Cottontail in Coastal Maine
Coastal managers in Maine employed the Habitat Priority Planner tool and C-CAP data to help identify suitable habitat for the endangered New England cottontail.
 Conveying the Visual Impacts of Small Docks and Piers in Massachusetts
CanVis was used to illustrate the visual impacts of docks and piers on ponds.
 Developing a Regional Sediment Budget for the Northern Gulf of Mexico
Sediment erosion and accretion were calculated for over 375 miles of shoreline, providing the first context for assessing regional impacts.
 Developing Consistent Methods for Mapping Sea Level Rise in Southeast Florida
Four counties joined forces with other agencies and organizations to agree upon consistent methods for mapping sea level rise to better prepare for sea level rise-related issues.
 Driving Conservation along South Carolina's Coast
The Habitat Priority Planner and participatory mapping techniques helped establish a National Scenic Byway on Edisto Island, South Carolina.
 Encouraging Collaborative Decision-Making Across the Watershed in New Hampshire
A New Hampshire project involving residents of towns within the Lamprey River watershed helped shape state legislation that strengthened watershed protections.
 Engaging Communities in New Hampshire to Strengthen Resilience
New Hampshire communities used the Roadmap for Adapting to Coastal Risk to assess and address vulnerabilities and work toward reducing risk.
 Enhancing Resilience to Coastal Hazards in Connecticut
The Roadmap for Adapting to Coastal Risk approach and Coastal Resilience Decision Support Framework helped inform a Connecticut community’s recovery response to Hurricane Sandy.
 Establishing Baseline Habitat Conditions to Monitor Salmonid Fishery Restoration in Alaska
Benthic habitat data and imagery help monitor change in the Klawock Lagoon after the construction of a culvert to restore ocean access.
 Establishing Conservation Goals in Southern Maine
The Habitat Priority Planner tool and C-CAP data helped in the development of a strategic conservation plan to preserve local communities for future generations.
 Evaluating Potential Impacts of Ocean Energy Projects in California
The Multipurpose Marine Cadastre and data helped evaluate potential impacts of ocean energy projects in California.
 Exploring Water Level Scenarios to Inform Shoreline Management on Lake Ontario
Lake-level drop scenarios and digital elevation models help regulators make informed shoreline management decisions.
 Forecasting Waves Associated with Hurricane Landfall in North Carolina
WEMo was used to hindcast wind wave energy distribution during Hurricane Isabel.
 Identifying Areas for Water Quality Improvement Projects in Oahu, Hawaii
The Habitat Priority Planner and N-SPECT were used with lidar and land cover data to identify sites that affect water quality in the Ko’olaupoko region.
 Identifying Areas Vulnerable to Sea Level Rise in Georgia
The Sea Level Rise and Coastal Flooding Impacts Viewer helped a barrier island community develop an adaptation plan to prepare for and adapt to sea level rise.
 Identifying Conservation Priorities for Sea Level Rise Adaptation in Coastal Maryland
Maryland used the Sea Level Affecting Marshes Model (SLAMM) to identify high-priority conservation areas that allow for wetland migration and future wildlife habitat.
 Identifying Priority Habitats for Conservation and Restoration in Coastal Alabama
The Mississippi-Alabama Habitat Mapper and the Habitat Priority Planner are being used to identify high-priority habitats, including those impacted by the BP Deepwater Horizon oil spill
 Identifying Sources of Pollution That Impact Coral Reef Communities in the Virgin Islands
C-CAP high-resolution land cover data helped identify watersheds where human land-use activity contributes to sediment and contaminants that impact coral reefs.
 Illustrating an Improved Community Streetscape in Connecticut
CanVis enabled officials to picture proposed changes to downtown areas.
 Illustrating the Aesthetic Impacts of Offshore Wind Turbines in Lake Erie
CanVis was used to show stakeholders how offshore wind turbines would impact Lake Erie vistas.
 Illustrating the Importance of Critical Infrastructure Data for Louisiana Coastal Parishes
The Coastal County Snapshots – Flood Exposure tool illustrates the importance of updating critical infrastructure maps for coastal parishes in Louisiana.
 Improving Communication between State Management Programs
The Digital Coast partnership facilitates better communication between members of the National States Geographic Information Council (NSGIC) and coastal state management programs.
 Improving Inundation Prediction and Visualization Capabilities for the New England Coast
Coastal flood Web-mapping applications help coastal managers in New England visualize and enhance awareness of coastal flooding.
 Informing Conservation Efforts in Coastal Georgia
Coastal conservation groups used the NatureServe Vista decision-support system to create new maps that aid in preservation of Georgia’s coastal habitat.
 Informing Ocean Planning Efforts with Authoritative Data
The Marine Cadastre’s Web services reduce the need for collecting spatial data for the Mid-Atlantic mapping portal.
 Integrating Decision Support Tools for Land Use Planning in Coastal Texas
Three decision-support tools were used to demonstrate the innovative application and integration of tools for land-use planning and ecosystem management.
 Linking Salt Marsh Distribution to Wind Wave Energy in North Carolina
WEMo helped reveal the link between marsh distribution and wave energy generated by extreme winds.
 Mapping Critical Habitats for Ecosystem-Based Management in California
Benthic habitat data and imagery supported an ecosystem based management project in Humboldt Bay and restoration efforts in the Eel River Estuary.
 Mapping Flood Forecasts for Better Flood Planning in Texas Communities
High-resolution elevation data were used to create inundation maps for various flood levels at river forecast locations.
 Mapping the Urban Realm to Enhance Community Resilience in Hawaii
C-CAP data helped identify priority urban forests, which enhance the health of coastal ecosystems and the resilience of coastal communities.
 Modeling Future Development for Eastern North Carolina
C-CAP and lidar data were used to model potential future growth and land cover change.
 Modeling Sediment Yield in Hawaii
N-SPECT was used to estimate the amount of sediment transported to Pelekane Bay.
 Partnering to Map Oceans and Coasts for Multiple Needs in North Carolina
High-resolution digital aerial imagery and topographic lidar support multiple applications throughout NOAA.
 Picturing Living Shorelines in Maryland
CanVis was used to give residents a clearer picture of how living shorelines look and function.
 Revealing the Effects of High-Rise Condominiums on Water Views in Pennsylvania
CanVis was used to illustrate the visual impact of high-rise condominium developments on scenic water vistas.
 Screening Potential Locations for Offshore Wind Energy Projects off the East Coast
The Multipurpose Marine Cadastre data helped in the screening of areas for offshore energy projects.
 Supporting Wave Energy Permitting in California
California created a series of authoritative maps using the Marine Cadastre.
 Using a Web-Based Tool to Designate New Marine Protected Areas in Southern California
MarineMap helped in the design of new marine protected areas off the coast of Southern California.
 Using Geospatial Techniques to Plan for Climate Change Impacts on Coastal Habitats in South Carolina
Partners used the Sea Level Affecting Marshes Model and Habitat Priority Planner to identify priority lands to conserve as sea level rises.
 Using Green Infrastructure Planning to Prioritize Coastal Resources in Maryland
Coastal managers in Maryland are using methods learned in the GIS Tools for Strategic Conservation Planning course to implement a new approach
 Using Lidar to Determine Bluff Recession Rates for Lake Erie
Lidar data replaced existing field-based methods used to measure bluff recession rates.
 Using Lidar to Plan for Sea Level Rise in Oregon
Coastal lidar and aerial photography made it possible to create a diked-land vulnerability inventory to help Oregon prepare for sea-level rise.
The Multipurpose Marine Cadastre data viewer enhanced communication in the development of “Wind Energy Areas.”
 Visualizing a New Public Recreation Area in South Carolina
Planning commissioners used CanVis to help visualize the benefits of a passive public park.
 Visualizing Flood Hazards with Residents and Floodplain Managers in Mississippi
A demonstration of the Sea Level Rise and Coastal Flooding Impacts Viewer spurred discussion at a hazards awareness exhibit.
 Visualizing Sea Level Rise to Engage Municipal Government Officials in Coastal South Carolina
Maps created using lidar-derived elevation data engage stakeholders and illustrate future impacts of tidal flooding caused by sea level rise.
 Visualizing the Impacts of Sea Level Rise in Delaware
Lidar data were used to generate maps showing the possible impacts of inundation using three different sea level rise scenarios.

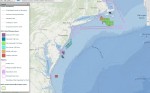
 Using Spatial Data and Web Mapping Tools to Support Wind Energy Planning off the North Carolina Coast