Maps and Data
Find maps and charts showing transportation data and trends related to alternative fuels and vehicles.
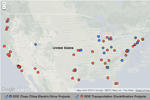
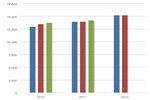
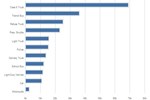
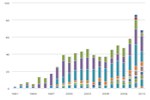
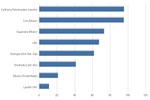
U.S. Alternative Fueling Stations by Fuel Type
| 1992 | 1993 | 1994 | 1995 | 1996 | 1997 | 1998 | 1999 | 2000 | 2001 | 2002 | 2003 | 2004 | 2005 | 2006 | 2007 | 2008 | 2009 | 2010 | 2011 | 2012 | |
| Electric* | 188 | 194 | 310 | 486 | 490 | 558 | 693 | 873 | 830 | 671 | 588 | 465 | 442 | 430 | 465 | 541 | 3394 | 13392 | |||
| Propane | 3297 | 3297 | 3299 | 3299 | 4252 | 4255 | 5318 | 4153 | 3268 | 3403 | 3431 | 3966 | 3689 | 2995 | 2619 | 2371 | 2175 | 2468 | 2647 | 2597 | 2654 |
| Methanol (M85) | 43 | 50 | 82 | 88 | 95 | 106 | 91 | 51 | 3 | ||||||||||||
| LNG | 72 | 71 | 66 | 46 | 44 | 44 | 36 | 62 | 58 | 40 | 37 | 35 | 38 | 36 | 39 | 45 | 59 | ||||
| Hydrogen | 7 | 7 | 9 | 14 | 17 | 32 | 46 | 63 | 58 | 56 | 58 | ||||||||||
| Biodiesel** | 2 | 16 | 79 | 142 | 176 | 304 | 459 | 742 | 645 | 679 | 644 | 627 | 675 | ||||||||
| CNG | 349 | 497 | 1042 | 1065 | 1419 | 1426 | 1268 | 1267 | 1217 | 1232 | 1166 | 1035 | 917 | 787 | 732 | 721 | 778 | 772 | 841 | 910 | 1107 |
| E85 | 2 | 7 | 32 | 37 | 68 | 71 | 40 | 49 | 113 | 154 | 149 | 188 | 200 | 436 | 762 | 1208 | 1644 | 1928 | 2142 | 2442 | 2553 |
Source: Alternative Fuels Data Center (AFDC), either directly (www.afdc.energy.gov/fuels/stations_counts.html) or from historical Transportation Energy Data Books (www.osti.gov/bridge/basicsearch.jsp)
Notes: Data snapshots for each year are based on the federal fiscal year and taken as close to September 30th of the indicated year as possible.
This chart shows the trend of U.S. alternative fueling stations by fuel type from 1992 to 2012. Propane stations were the most numerous until 2011, when they were surpassed by electric vehicle supply equipment (EVSE), or charging units. The number of EVSE units increased dramatically in 2011 and 2012, following the 2010 introduction of plug-in electric vehicles by major automakers. The number of E85 stations has been increasing steadily since 2004, as the number of flex-fuel vehicles available from major manufacturers has increased. The number of CNG stations decreased between 1996 and 2006 (despite the increase in CNG sales during this time) largely because the average station size was increasing.
*Electric charging units, or EVSE, are counted once for each outlet available, even when multiple outlets are present at a single location. Includes legacy chargers, but does not include residential electric charging infrastructure.
** Stations selling low-level biodiesel blends (less than B20) are included in the station listing only for the years 2005-2007.
In totals by year, stations with multiple fuels are counted once for each fuel.