Maps and Data
Find maps and charts showing transportation data and trends related to alternative fuels and vehicles.
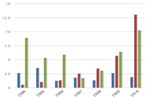
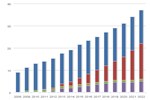
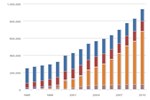
Clean Cities Petroleum Savings by AFV Type
| 2004 | 2005 | 2006 | 2007 | 2008 | 2009 | 2010 | 2011 | |
| CNG | 88.8 | 56 | 81 | 102 | 104 | 85.398 | 140.639750788926 | 167 |
| E85 | 16.3 | 26 | 45 | 37 | 37 | 72.783 | 38.57599089271499 | 49 |
| Biodiesel | 21.4 | 47 | 63.2 | 61 | 74 | 38.976619934563 | 28.520535473764003 | 70 |
| LNG | 0 | 8 | 15.7 | 9 | 14 | 11.939 | 23.419107788602002 | 28 |
| Propane | 39.4 | 32 | 42 | 30 | 25 | 18.229 | 18.259948864866 | 19 |
| Electric | 3.2 | 2 | 5 | 5 | 4 | 29.355 | 8.512272418535002 | 16 |
Source: Clean Cities annual metrics reports, 2004-2011.
Notes: Savings are measured in gasoline-gallon equivalents (GGEs), representing a quantity of fuel with the same amount of energy contained in a gallon of gasoline.
This chart shows trends in Clean Cities petroleum savings by various types of alternative fuel vehicles from 2004 to 2011.