Maps and Data
Find maps and charts showing transportation data and trends related to alternative fuels and vehicles.
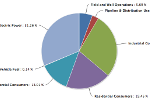
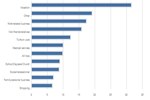
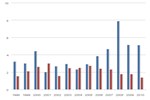
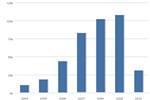
Means of Transportation to Work
| 1980 | 1990 | 2000 | 2009 | |
| Drive alone | 62193 | 84215 | 97102 | 105476 |
| Car pool | 19065 | 15378 | 15635 | 13917 |
| Public transportation | 6175 | 6070 | 6068 | 6922 |
| Walk only | 5413 | 4489 | 3759 | 3966 |
| Work at home | 2180 | 3406 | 4184 | 5918 |
| Other means | 703 | 809 | 901 | 1176 |
| Bicycle | 468 | 467 | 488 | 766 |
| Motorcycle | 419 | 237 | 142 | 294 |
Source: Oak Ridge National Laboratory. Transportation Energy Data Book #30. Table 8.15
This chart shows how people commuted to and from their workplaces between 1980 and 2009. The percentage of people driving alone increased during the years shown, as the percentage of people carpooling decreased. Walking has become less popular, but advances in communication technology have allowed more people to work from home.