Maps and Data
Find maps and charts showing transportation data and trends related to alternative fuels and vehicles.
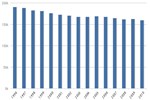
Average Per-Passenger Fuel Economy of Various Travel Modes
| Intercity Rail | Motorcycles | Transit Rail | Commuter Rail | Airlines | Cars | Light trucks | Transit Buses | Demand response** | |
| pmpGGE | 50.053798767967145 | 49.545121951219514 | 48.442368839427665 | 43.34317211948791 | 43.12845010615711 | 34.44912379875636 | 33.27354627354627 | 28.73196605374823 | 7.790412272291467 |
Source: Oak Ridge National Laboratory Transportation Energy Data Book 30, Table 2.12.
Notes: *Fuel use is measured in gasoline-gallon equivalents (GGEs), representing a quantity of fuel or electricity with the same energy content as a gallon of gasoline. Rail is powered by electricity to a large extent.
This chart shows average per-passenger fuel economy of various modes of passenger travel. Motorcycles achieve a high number of passenger miles per gallon, owing to very high fuel efficiency. Intercity rail, transit rail, and commuter rail all achieve relatively high values due to high ridership and energy efficiency of rail transport. Transit buses are not very efficient at their current ridership rates, where, on average, a given bus is less than 25% full. Demand response vehicles are the least efficient, because they need to use fuel just to get to the passenger.
** Includes passenger cars, vans, and small buses operating in response to calls from passengers to a dispatcher.