Maps and Data
Find maps and charts showing transportation data and trends related to alternative fuels and vehicles.
U.S. Light-Duty Fuel Consumption and Vehicle Miles Traveled (VMT)
| 1970 | 1971 | 1972 | 1973 | 1974 | 1975 | 1976 | 1977 | 1978 | 1979 | 1980 | 1981 | 1982 | 1983 | 1984 | 1985 | 1986 | 1987 | 1988 | 1989 | 1990 | 1991 | 1992 | 1993 | 1994 | 1995 | 1996 | 1997 | 1998 | 1999 | 2000 | 2001 | 2002 | 2003 | 2004 | 2005 | 2006 | 2007 | 2008 | 2009 | 2010 | |
| LDV Fuel Consumption per Person | 391.08352491790697 | 408.8527508618286 | 434.37813139000417 | 449.08328836556376 | 425.49920891336035 | 432.15242975692735 | 455.18057182686783 | 461.177983707269 | 471.5401307941692 | 449.6913368189691 | 413.60720359099713 | 405.38973027132914 | 397.19563482702205 | 403.9583049593798 | 408.96014365311544 | 416.3642570263137 | 426.58141563921356 | 429.63632305977734 | 434.3529353221291 | 435.0988247334255 | 422.1168662893128 | 406.03058710260706 | 415.3999662802325 | 423.5826334975319 | 426.37776700751846 | 427.6464144050922 | 433.46669894451065 | 438.2286394757615 | 443.5793675920805 | 452.81536312721823 | 447.29247492159544 | 446.4461776685406 | 454.7624255033585 | 469.83060632119265 | 474.4020045280372 | 461.45239548098675 | 455.1852585183498 | 420.9900172913245 | 397.5491863831676 | 396.89827659906746 | 396.98318364037937 |
| LDV Miles per Person | 5086.339635687062 | 5334.698008328269 | 5632.874765167654 | 5794.983830495978 | 5590.044621485746 | 5742.744959757715 | 6008.443665536445 | 6203.171843551626 | 6438.362555675193 | 6283.703716141788 | 6217.392379131561 | 6277.037971781701 | 6378.8976555904055 | 6550.5117735294625 | 6758.544512607227 | 6921.731194161359 | 7093.903838475593 | 7356.331585735341 | 7699.4252519414085 | 7892.688005439744 | 7982.443463681168 | 7969.770339339516 | 8142.2385372282515 | 8198.336319063106 | 8289.570334490281 | 8403.98642483921 | 8523.989321169116 | 8668.26574332353 | 8802.243522177216 | 8890.139429675228 | 8979.683973343956 | 9054.17395715351 | 9152.27302989354 | 9181.906415419626 | 9340.439514119671 | 9331.856619847138 | 9327.319315752062 | 8994.069013833327 | 8709.734644669228 | 8644.993911420088 | 8619.012228892227 |
Source: Bureau of Transportation Statistics (BTS) Table 4-11, 4-12, 1-32 (for VMT).
Notes: Data for 2007-2009 were calculated using new vehicle categories not consistent with previous years.
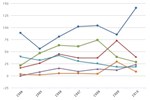
This chart shows annual per capita average vehicle miles traveled and per capita fuel use from 1970 through 2010 in light-duty vehicles (LDVs). During the past four decades, the number of vehicle miles traveled by the average American has increased relatively steadily, with notable exceptions after the oil price shocks and supply disruptions of 1974, 1979, and 2008. The overall increase in average vehicle miles traveled is attributable to a number of factors, including increased vehicle ownership and increased suburbanization and commute distances. Per capita fuel use has fluctuated with oil prices, average vehicle fuel efficiency, and economic conditions, but today it remains remarkably close to what it was 40 years ago, despite gains in fuel efficiency.