Maps and Data
Find maps and charts showing transportation data and trends related to alternative fuels and vehicles.
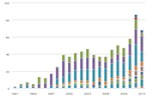
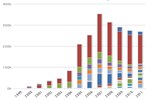
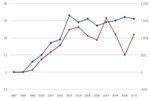
Clean Cities Petroleum Savings by Fuel Economy and VMT Reductions
| 2004 | 2005 | 2006 | 2007 | 2008 | 2009 | 2010 | 2011 | |
| Fuel Economy Improvement | 0.01 | 0.04 | 5.5 | 2.4 | 0.4 | 2.6 | 4.4 | 10.4 |
| VMT Reduction | 0.15 | 1.5 | 1.9 | 2.7 | 3.5 | 5.7 | 23.2 | 34.5 |
Source: Clean Cities annual metrics reports, 2004-2011.
Notes:
Savings are measured in gasoline-gallon equivalents (GGEs), representing a quantity of fuel with the same amount of energy contained in a gallon of gasoline.
This chart shows Clean Cities petroleum savings achieved through fuel economy improvements and reductions in vehicle miles traveled (VMT) from 2004 through 2011.
VMT reduction includes measures such as carpooling, telecommuting, using mass transit, bicycling, and improved route planning.