Maps and Data
Find maps and charts showing transportation data and trends related to alternative fuels and vehicles.
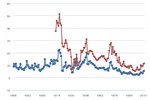
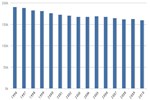
Monthly Fluctuation in U.S. Vehicle Miles Traveled
| JAN | FEB | MAR | APR | MAY | JUN | JUL | AUG | SEP | OCT | NOV | DEC | |
| Avgerage VMT Traveled | 223.6 | 214.79999999999998 | 250.79999999999998 | 252.63333333333335 | 257.43333333333334 | 260.09999999999997 | 265.2 | 263.46666666666664 | 244.16666666666666 | 255.13333333333335 | 239.86666666666665 | 242.53333333333333 |
Source: Federal Highway Administration
Notes: VMT counts include those of light-, medium-, and heavy-duty vehicles.
This chart shows total U.S. vehicle miles traveled (VMT) each month of the year, averaged over a three-year period. U.S. drivers tend to log the fewest vehicle miles in January and February and the most miles in July and August.