Skip Navigation
www.ahrq.gov
AHRQ Home
|
Questions?
|
Contact Us
|
Site Map
|
What's New
|
Browse
|
Información en español
|
E-mail Updates
Effective Health Care
Log In
or
Create a New Account
Search Effective Health Care
Home
Slides
Home
Tools and Resources
Research Summaries for Consumers, Clinicians, and Policymakers
Search for Research Summaries, Reviews, and Reports
Research Available for Comment
Submit a Suggestion for Research
Submit Scientific Information Packets
Comparative Effectiveness Research Grant and ARRA Awards
News and Announcements
What Is Comparative Effectiveness Research
Who Is Involved in the Effective Health Care Program
What Is the Effective Health Care Program
Site Map
Glossary of Terms
Help and Support
Contact the Effective Health Care Program
Join the E-mail List
Personalization and Social Media Tools
Viewers, Players, and Plug-ins
Slide Tray
0
slides
View
Empty
Download
Return to Slide Library
Slides
Search Slides
Add Presentation to Slide Tray
Presentation:
Quantitative Synthesis I Quiz
Authors:
Joseph Lau, M.D., and Thomas Trikalinos, M.D., Ph.D.
Slides: 1–8 of 8
View per page:
12
20
28
36
Add to tray
Remove from tray
Quantitative Synthesis I Quiz
Add to tray
Remove from tray
Binary Data
Add to tray
Remove from tray
Reasons for a Meta-analysis
Add to tray
Remove from tray
Fixed Effects Model Versus Random Effects Model
Add to tray
Remove from tray
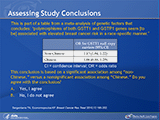
Assessing Study Conclusions
Add to tray
Remove from tray
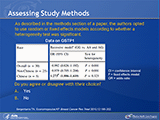
Assessing Study Methods
Add to tray
Remove from tray
Summary
Add to tray
Remove from tray
Authors
Your slide tray is being processed.


 E-mail Updates