Maps and Data
Find maps and charts showing transportation data and trends related to alternative fuels and vehicles.
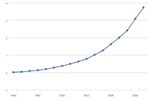
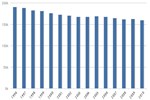
Public Retail Gasoline Stations by Year
| 1996 | 1997 | 1998 | 1999 | 2000 | 2001 | 2002 | 2003 | 2004 | 2005 | 2006 | 2007 | 2008 | 2009 | 2010 | |
| Total U.S. | 190.246 | 187.892 | 182.596 | 180.567 | 175.941 | 172.169 | 170.018 | 167.571 | 167.346 | 168.987 | 167.476 | 164.292 | 161.768 | 162.35 | 159.006 |
Source: National Petroleum News (NPN)
Notes: Download the attached file to view data broken down by state.
This chart shows the number of U.S. public retail gasoline stations from 1996 to 2010. The number of stations has declined fairly steadily during this time period, totaling just less than 160,000 stations in 2010. The decline in number of stations does not reflect lower volumes of petroleum sold: Rather, the decline in stations can be attributed to station consolidation as low-volume stations were replaced by large, high-volume stations in optimal locations.