Maps and Data
Find maps and charts showing transportation data and trends related to alternative fuels and vehicles.
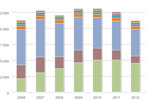
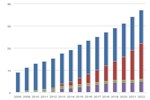
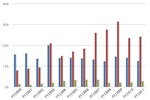
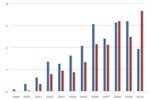
Composition of U.S. Light-Duty Fleet by Vehicle Type Over Time
| 1975 | 1976 | 1977 | 1978 | 1979 | 1980 | 1981 | 1982 | 1983 | 1984 | 1985 | 1986 | 1987 | 1988 | 1989 | 1990 | 1991 | 1992 | 1993 | 1994 | 1995 | 1996 | 1997 | 1998 | 1999 | 2000 | 2001 | 2002 | 2003 | 2004 | 2005 | 2006 | 2007 | 2008 | 2009 | 2010 | 2011 | |
| % Car Sales | 80.80000000000001 | 79.10000000000001 | 80.30000000000001 | 77.60000000000001 | 77.9 | 83.6 | 82.8 | 80.5 | 78 | 76.6 | 75.3 | 72.1 | 72.89999999999999 | 71 | 70.1 | 70.39999999999999 | 69.6 | 68.7 | 67.7 | 61.9 | 64.1 | 63.7 | 61.5 | 59.3 | 59.3 | 59.699999999999996 | 61.199999999999996 | 58.8 | 56.699999999999996 | 55.1 | 57.199999999999996 | 60 | 61.199999999999996 | 61.5 | 69.19999999999999 | 64.3 | 62.4 |
| % Truck Sales | 19.2 | 20.9 | 19.7 | 22.400000000000002 | 22.1 | 16.400000000000002 | 17.2 | 19.5 | 22 | 23.400000000000002 | 24.7 | 27.900000000000002 | 27.1 | 28.999999999999996 | 29.9 | 29.599999999999998 | 30.4 | 31.3 | 32.300000000000004 | 38.1 | 35.9 | 36.3 | 38.5 | 40.699999999999996 | 40.699999999999996 | 40.300000000000004 | 38.800000000000004 | 41.199999999999996 | 43.3 | 44.9 | 42.8 | 40 | 38.800000000000004 | 38.5 | 30.8 | 35.699999999999996 | 37.6 |
Source: Environmental Protection Agency (EPA) Table 1 and 2.
Notes: Truck data includes vans, SUVs, and trucks with gross vehicle weight ratings of up to 8,500 pounds.
This chart shows trends in fleet composition by weight categories in U.S. light-duty vehicles from 1975 to 2011. The relative popularity of light trucks (including trucks, SUVs, and vans) increased fairly steadily from the early 1980s through the mid-2000s. Following the oil price spikes of 1979 and 2008, there were notable decreases in the percentage of light trucks. See also Efficiency and Power of U.S. Light-Duty Vehicles Over Time.